![MiFlora MiFlora]() This entry is all about InfluxDB, Grafana and a cute little Bluetooth garden sensor!
This entry is all about InfluxDB, Grafana and a cute little Bluetooth garden sensor!
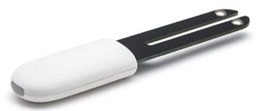
Some time ago a pal of mine and I did some swaps of spare kit and I ended up with a Mi Flora sensor. A rather pleasing looking device, the MI Flora has a 3v lithium button cell and can transmit by Bluetooth LE, the light level, temperature, battery level and moisture.
Battery is supposed to last for months. I’ve provided an AliExpress link above which puts the units at under £8 Inc. postage. No doubt that price will vary dramatically depending on where you chose to spend your money. Amazon charge more like £13.
So having pulled off the protective tab which meant the battery would work, I put the unit to one side as I had no idea how to read it.
A week or so later in Spain, with poor weather my pal Jay came on to ask me if I’d used it. I had not – and so we decided to give it a go. As it turned out I had some cheap Bluetooth 4 dongles I’d bought on a whim last year. I plugged one into my Raspberry Pi 2. The program “hcitool” lets you scan for Bluetooth devices and as it happens it was already installed on the Pi. From the command prompt:
sudo hcitool lescan
Instant success as the Mi Flora device with it’s MAC address was revealed. I made a note of the MAC address.
I would need Python 3 to experiment – but this was already installed on the Pi and some code to get the information from the unit. This code turned out to be ok with a little modification. I ended up creating a folder called /home/pi/myflora and dumping the lot in there.
Jay had modified the program to send MQTT. That of course needed the PAHO client. In order to do that I needed something called PIP.
sudo apt-get install python3-pip
sudo pip3 install paho-mqtt
Note NOT pip (which works for Python 2.7) but pip3.
I then added to the MI flora directory a test program which Jay sent me called bathroom.py – presumably because he’d put the sensor in his bathroom – I adjusted the output slightly as I was putting my unit in the garden
import sys
import paho.mqtt.client as mqtt
from miflora.miflora_poller import MiFloraPoller, \
MI_CONDUCTIVITY, MI_MOISTURE, MI_LIGHT, MI_TEMPERATURE, MI_BATTERY
poller = MiFloraPoller("C4:7C:8D:32:08:63")
print("Getting data from Mi Flora")
print("FW: {}".format(poller.firmware_version()))
print("Name: {}".format(poller.name()))
print("Temperature: {}".format(poller.parameter_value(MI_TEMPERATURE)))
print("Moisture: {}".format(poller.parameter_value(MI_MOISTURE)))
print("Light: {}".format(poller.parameter_value(MI_LIGHT)))
print("Conductivity: {}".format(poller.parameter_value(MI_CONDUCTIVITY)))
print("Battery: {}".format(poller.parameter_value(MI_BATTERY)))
# Publishing the results to MQTT
mqttc = mqtt.Client("miflorabathroom")
mqttc.username_pw_set("admin","xxxx")
mqttc.connect("192.168.1.19", 1883)
mqttc.publish("miflora/garden", "{ \"battery\" : " + str(poller.parameter_value(MI_BATTERY)) + ", \"version\" : \"" + str(poller.firmware_version()) + "\", \"sunlight\" : " + str(poller.parameter_value(MI_LIGHT)) + ", \"temperature\" : " + str(poller.parameter_value(MI_TEMPERATURE)) + ", \"moisture\" : " + str(poller.parameter_value(MI_MOISTURE)) + ", \"fertility\" : " + str(poller.parameter_value(MI_CONDUCTIVITY)) + " }")
mqttc.loop(2)
# End of MQTT section
So the idea was that running “python3 garden.py” would send some MQTT to my Mosquitto MQTT broker – and indeed it did (change MAC address for the MI Flora and MQTT details in the above). Subscribing to “miflora/garden” did the trick – I could fire off the program and with in seconds I’d see the resulting JSON package coming out into my MQTT-Spy client.
Next job was to get Node-Red talking to the MI Flora – I used an INJECT node, set to retrigger every 15 minutes – firing off to an EXEC node which contained nothing more than “python3 /home/pi/miflora/bathroom.py”
That worked – so now I had a regular supply of data in the form of an easy to use JSON package.
I split the package up – and fed it into a Node-Red Dashboard graph – and that was my first disappointment. If you fire more than 4 items into those graphs – the popup fails to show all of them – and the graphs are not very good anyway. I think a lot more work needs to go into that.
I do use GROVESTREAMS on-line (which is REALLY flexible) to store data remotely but there’s a limit as to how far back you can read for free – that was not the case when I first started using them and wrote the Node-Red-Contrib-Grove node to make it all easy.
So now I was on a search for a decent graphics package that would run on the Raspberry Pi (or similar). NOT as easy as it sound, unless you’re very easily pleased when it comes to graphics.
After a lot of experimenting I decided to give Grafana a shot. I think if I started writing this blog again, I would would have Grafana in the title because this really, as it turns out, is the star of the show.
Having seen a few screenshots, I had visions of populating a SQLITE 3 database and firing that data into Grafana.
Erm, no. Despite (wait for it) using SQLITE internally to store users and dashboards, the package does not actually support SQLITE for data !!! I've explained that now, to save you some confusion later. When I did the install, it kept referring to SQLITE and could I HELL figure out how to set up a database for my data – that’s why.
As a Pi user (that means SD use so I’m not keen on MySQL as SD has limited WRITE capability and I worry about databases shortening the life of the SD - see the later article on SD life - very informative) the options for data sources did not look appealing to me at all, the least offensive being INFLUX and that is the one I settled on – partly as there is a node for it available for Node-Red. Despite the pretty website this is still very preliminary at version 1.02. Influx doesn’t use terms like tables and fields which kept me going for a couple of hours – but it is good at storing time-stamped data – indeed you don’t even do the time-stamping. You create an empty database and start firing data at the DB in pairs – stream name – and data value – it really is very simple once you get started. I guess you could think of it as a single table with pairs of data-name and data-value. I went down a few dead ends and discovered if you got your stream names wrong – good luck renaming them as INFLUX does not support renaming!
Anyway, it ‘s all very easy once you get started. I did things backwards and installed Grafana first. Here’s what I did – no guarantee it will work for you.
You might want to consider reading this before using InfluxDB on the Pi for long-term use - there are very few build options for small SBCs and this article gives the impression it likes more RAM than we would normally have on the likes of the Pi. I do have to say though that it is working just fine on mine after several days of operation. Comments welcome.
I grabbed the Grafana file for my Pi from here. https://github.com/fg2it/grafana-on-raspberry
sudo dpkg -i grafana_4.1.2-1487023783_armhf.deb
sudo /bin/systemctl daemon-reload
sudo /bin/systemctl enable grafana-server
That was Grafana up and running on port 3000 – user name admin, password admin to actually DO anything – and quickly change that password!!! I did that, went into the ini file and disabled user registration as the admin can do that and opened up port 3000 redirect in my router so I could access this from the outside world. That all worked well.
wget http://ftp.us.debian.org/debian/pool/main/i/influxdb/influxdb_1.0.2+dfsg1-1_armhf.deb
sudo dpkg -i influxdb_1.0.2+dfsg1-1_armhf.deb
That set up influx and that ran without further ado at port 8083. I did NOT open that up to the outside world. In there I created a new empty database called “logger”
![logger logger]()
In Grafana – which supports influx without any changes, I followed Engineer John’s instructions to set up the data-source and a new Dashboard.
So the next thing – would be to get some data. I played with this for some time – should I keep incoming data source names simple – as you can’t rename them? Then Jay pointed out that in Grafana you can ALIAS names. That did it. So in influxDB node for Node-Red, you fire in a payload – and depending where you want to put your data – you use msg.measurement.. Yes, exactly, what’s wrong with msg.topic you might ask. So here is my little MI Flora MQTT node firing values into InfluxDB
![MiFlora[6] MiFlora[6]]()
And that yellow function block…
node.status({fill:"blue",shape:"dot",text: msg.payload});
tmp=JSON.parse(msg.payload);
msg.measurement="battery"; msg.payload=tmp.battery; node.send(msg);
msg.measurement="sunlight"; msg.payload=tmp.sunlight; node.send(msg);
msg.measurement="temperature"; msg.payload=tmp.temperature; node.send(msg);
msg.measurement="moisture"; msg.payload=tmp.moisture; node.send(msg);
msg.measurement="fertility"; msg.payload=tmp.fertility; node.send(msg);
Yes, I know – far better ways to do this – but it was my first stab at it and it worked. For general use however I added an incoming function that merely copies msg.topic into msg.measurement and that means any single data-source coming in via MQTT can be blasted straight into InFluxDB.
Yes, that’s write – you don’t create tables or fields – you just send in field names and data and that’s it!
I also fed in some data from my general sensors – with horrible topics like pergola/lighting but of course thanks to the Grafana alias ability – names like that would not show up in Dashboards.
Having stored up some data it was time to get it into graphs – I took the VERY simplest approach of showing lines as I have at this point no idea what some of the Grafana functions do – I DO know that smoothing the data might be fun as Grafana relies on the data-source to do that and Influx doesn’t do that. What IS nice is that you don’t have to worry about things like “I want the last 5 minute’s worth” or “show me the last month’s worth” as Grafana does all of that for you – from here it gets easy.
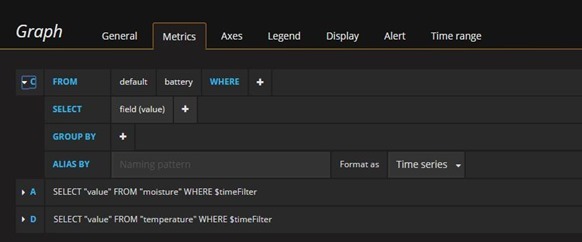
New dashboard and under metrics ADD ROW – takes an hour or so to get to grips with this..
![Grafana setup Grafana setup]()
I’ve expanded the top one here – I have 3 lines in that one graph – see the blank ALIAS BY - if you want to change the source name (in this case battery) put something in there.
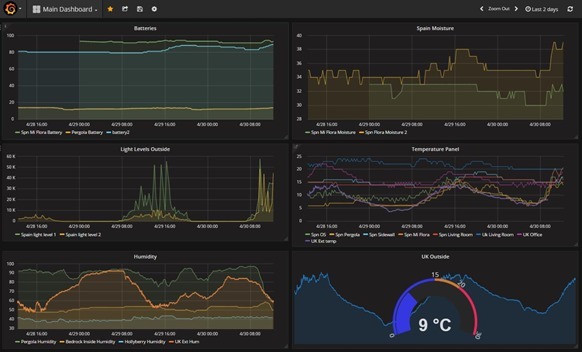
And that is how I got to this point…
![Grafana imagery - my stats Grafana imagery - my stats]()
So top left you see battery status from my deep discharge battery and the two MI Flora units, then moisture levels from the two units – light levels – and on the right centre – a whole host of temperature readings, overall humidity and finally just to play with – the UK temperature split off and displayed differently.
There’s a lot to take in – and I am as you can see NOT an expert at this yet so before firing questions back – you might want to spend some time looking at the links on this blog entry and using Google. If you think another database is better by all means write in to say why – and if you think there’s a better easy-to-fit-in-Pi graphing system, preferable one that works with SQLITE – again do let us know. I started all of this with zero information late afternoon yesterday and had it all working by the end of last night – so it’s not THAT big a deal even if my clumsy writing makes it look that way.
Not entirely sure what’s going on the this battery level on my first day – but it did occur to me that the unit is intended for putting into plant-pots – not sitting outside in the sopping rain so I’ve covered it in cling-film!! As we’re off back to the UK for a few weeks, I don’t want to come back to a rusted heap. Note the Mi Flora battery at the top – seems to be self-recovering!!
Update: the little Bluetooth sensors have now been running for months and the battery levels remain fine – the Bluetooth range however is crap – best to have a Bluetooth dongle nearby to talk to them – don’t even think about two thicknesses of wall!
![Grafana Output Grafana output]()
Update 27/03/2017: I've been hitting issues with out of bounds temperature data – i.e. a couple of duff readings crept in - with values like 2000 and -64 which of course flattened the data completely. I realised quickly that InfluxDB has no DELETE function and as far as I could tell - things like comparing data with a value made the graph line disappear.
I put something up on the web and someone came back and asked if I was using InfluxDB 1.2 which apparently has a DELETE function. Well, I wasn't - I was way back at 1.01 - worse - the same folder where that came from only went up to 1.1
However, thanks to THIS helpful chap - I easily updated to Influx 1.2 without the issue he described. I STILL can't add something like "where value < 100" but maybe I can delete ??? Anyone with more info on this please by all means chip in...
Update 18/04/2017: I've just fitted the second of these units and also fixed a minor error in the code above. All that is needed for a second unit is a copy of the program with different MAC address and different MQTT publish address. Sure you could use the same one twice with command line parameters but I took the easy option.
Bluetooth RANGE is becoming an issue. The Pi is in my office - breezeblock wall then the garden - the second unit I tried maybe 15ft or so from the office wall - not a chance. Clearly BT4 is good for power, not so good for range.
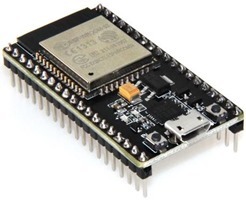
So - there's a nice job for an ESP32... BT in - WIFI out. A relay!
Update 30/04/2017: At the time of writing, InfluxDB is up to version 1.2.2 and if you follow the link I gave above but instead of 1.2.0 use 1.2.1 in the two relevant links - you will get the latest version of InfluxDB. Similarly I found Grafana 4.20 - same place as before but called https://bintray.com/fg2it/deb/download_file?file_path=main%2Fg%2Fgrafana_4.2.0_armhf.deb
I just repeated the Grafana install routine to update it using the new simpler name grafana_4.2.0_armhf.deb - all worked perfectly.
I'm pretty happy with Grafana and I now know how to delete data points (by time) but if you really want to use SQLITE and do your own thing - take a look at the excellent work that Csongor Varga has done - https://www.youtube.com/watch?v=nkKf26oKzhQ
If you like this post – please share a link to it by social media, by email with friends or on your website.
More readers means more feedback means more answers for all of us. Thank you!
![Share on Facebook Facebook]()
![Share on Google+ google_plus]()
![Pin it with Pinterest pinterest]()
![Share on Linkedin linkedin]()
The post Garden Data Collection appeared first on Scargill's Tech Blog.





![MiFlora[6] MiFlora[6]](http://tech.scargill.net/wp-content/uploads/2017/02/MiFlora6_thumb.jpg)

![ESP32[6] ESP32[6]](http://tech.scargill.net/wp-content/uploads/2017/05/ESP326_thumb.jpg)


![Exec node[10] Exec node[10]](http://tech.scargill.net/wp-content/uploads/2017/05/Exec-node10_thumb.jpg)
![exec node[6] exec node[6]](http://tech.scargill.net/wp-content/uploads/2017/05/exec-node6_thumb.jpg)







![K2[7] K2[7]](http://tech.scargill.net/wp-content/uploads/2017/05/K27_thumb.jpg)