Quantcast
Channel: Scargill's Tech Blog
Viewing all 1391 articles
Browse latest View live

A Christmas Script

$
0
0

tmp81FFOver the weekend, reader Antonio Fragola (Mr Shark) and I have been working on a couple of things together (no we’re not in the same country – Skype). Regular reader will know about the script that a couple of us originally developed to put Node-Red and several other packages onto the Raspberry Pi for home control purposes. Well, that mutated to run on several different boards and my one big gripe has been the amount of interaction once the script starts.  After reading some comments about how good Xenial (Ubuntu) is – we’ve also made the script compatible with this. So Raspbian, DietPi (Debian) and Xenial.

Before I begin – no, we’re not a support shop – you may or may not end up having to tweak things for your system but please don’t write in to say “I tried this on a Mac and it doesn’t work”).

That level of interaction is now zero thanks to a new menu-driven approach and many improvements including using a VM (virtual machine) to test the whole thing at accelerated speeds.

What is this about?

What we have here is an explanation of how to get Xenial running in a VM – the purpose of this is merely as a base to test the new script mentioned below which will install somewhat more than the original script (designed originally for Raspberry Pi but now working on several Debian-based devices and now Xenial) – namely:

  • Node-Red at port 1880 – complete with MQTT and many NODES
  • NODEJS/NPM
  • Webmin at port 10000
  • Apache at port 80
  • Ha-Bridge at port 82 (suitable for Amazon Alexa)
  • PHPLiteAdmin (for SQLITE – also installed)
  • MC File manager and editor
  • Lots more – see the menu screen

The Virtual Machine

Let’s take a look at what we did – you can of course duplicate all of this as you go along. We used the excellent VMware of VirtualBox on Windows PCs. This explanation covers VMware.

So – first things first – we loaded up a copy of VMware (I used VirtualBox but the procedure is similar – VMware player is free of you can use the full commercial workstation) and made sure it works. That much is up to you. There is a wizard for creating new virtual machines -  we chose a CUSTOM machine. Steps from that point on were:

NEXT - NEXT – “I will install the operating system later” – NEXT
Linux / Ubuntu 64-bit – NEXT – d:\test  - NEXT
Number of processors – 1  - number of cores – 1 – NEXT
Memory for this machine – 1024MB – NEXT
Use Bridged Connection - NEXT
I/O Controller type LSI Logic - NEXT
Disk Type SCSI - NEXT
Create a new virtual Disk - NEXT
12GB (I used 16GB – 8GB would have done) – Store virtual disk as a single file - NEXT
At this point we gave the file a name – in our case d:\test\Ubuntu 640bit.vmdk -  NEXT – FINISH

Under settings – hardware – CD/DVD we ticked “Use ISO image file” and selected the file we loaded from the Ubuntu website – “Ubuntu-16.04.1-server-amd64.iso” – OK.

At this point you’ll note reference to AMD64 – that had me as well but it works a treat on INTEL hardware.

Start off the VM – you get asked which language to use (ENGLISH) and various options will come up – the first being “Install Ubuntu Server” – that’s the one.

Once again you’ll get a language question – English. Location – in my case “United Kingdom” – if you don’t fit into the rules use “Other”.

Time Zone in my case – EUROPE  and then country. Locale – in my case United Kingdom.

Hostname – we went with the default “Ubuntu” – but call it whatever you want.

At this point you get asked to create a user – it is important you make a user “pi”. Enter password also.

tmp6049Home encryption – we said no. When asked if the time zone was correct we said yes.

Partitioning – “use entire disk” (remember this is a virtual disk – not your real disk). You are then asked to confirm erasing disk – go with that. You then get asked to confirm AGAIN. YES.

HTTP Proxy just leave blank – CONTINUE.

Install security updates automatically.

Add OpenSSH server and CONTINUE (important for remote access)

Install GRUB bootloader – YES.

Installation is complete – CONTINUE. Let it run.

And voilà – one working copy of Ubuntu. You have a pi user – at this point you’ll want to give ROOT user a password (sudo passwd root).

You need ROOT user for the next step.

No matter what machine you are using – you need a “pi” user and to make life simple – and compatible with that of the original Raspberry Pi user, a little command line work is needed. The rest is handled in the script.

So as ROOT user…

adduser --quiet --disabled-password --shell /bin/bash --home /home/pi --gecos "User" pi echo "pi:password" | chpasswd usermod pi -g sudo echo "pi ALL=(ALL) NOPASSWD: ALL" > /etc/sudoers.d/pi chmod 0440 /etc/sudoers.d/pi

The FIRST and SECOND lines are not needed if you followed the instructions above as you already a “pi” user.

tmpB7DFSo now we have a pi user able to do SUDO commands.

The BASH Script

This part is about running the script and assumes a “pi” user with SUDO capability.

Create a file called script.sh in the pi directory and populate it from the script. https://bitbucket.org/snippets/scargill/94yxL

Ensure it has the right permissions.

and that is that. as PI user, in the /home/pi directory you should now have this script. DO NOT run this as ROOT user.

At this point BACK EVERYTHING UP to avoid disappointment – no, REALLY.

Execute as:

./script.sh

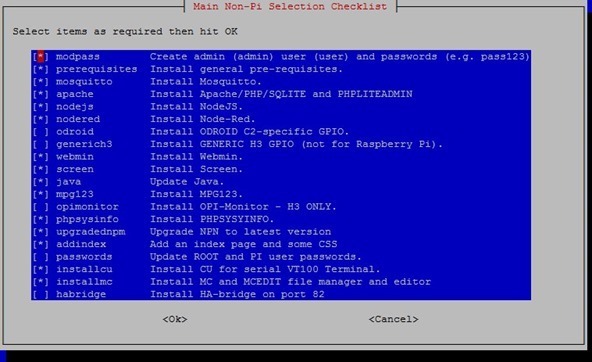
You will see a menu which will vary slightly depending on which system you are using – you won’t be asked about GPIO on a Raspberry Pi for example.

tmpE673

For the VM we left everything as you see here and tabbed to OK.

At this point you will be asked for a USER and ADMIN names (which can be user and admin if you like) and corresponding passwords. From there on – everything should happen with no user interaction.

After maybe 15 minutes – or an hour – depending on your system – you’ll see an invite to REBOOT – so REBOOT. When the board/VM boots up you will find hopefully a working system. Node-Red runs at port 1880, Webmin at port 10000 (Webmin needs Pi or ROOT username and pass until we figure out how to add in the ADMIN user).

You should have Apache at port 80  HA-BRIDGE (if installed) will run at port 82 – It seems that Amazon Echo is quite happy with this but the Google product wants port 80! 

Node-Red should include MQTT which will need admin username and password as will Node-Red itself. USER name and password is used by Node-Red Dashboard.

There is also the excellent MC – a file manager and editor.

MC and MC EDIT

More on this later but the tools are covered elsewhere in this blog under items about the older script and that information is still valid.

Facebooktwittergoogle_pluspinterestlinkedin

Project Boxes

$
0
0

boxesFor those few of us left in the world who don’t have 3d printers… boxes for our projects are always an issue…  I’ve decided I want to use DIN rail enclosures because in Spain, the large household Din rail mains boxes are dirt cheap – just need some enclosures for power supplies and SBCs and ESP8266 boards – and I hit this by accident..

Some of these are DIRT cheap – like a tenner for 5 boxes… I’m still wading through. So the question is – do others have links to similarly inexpensive boxes? 

Facebooktwittergoogle_pluspinterestlinkedin

Happy New Year 6000+ members

$
0
0

Stunning, well over 6,100 of you registered in here now and climbing! Thanks to everyone and especially those who've submitted great feedback over the last year.

I'll be very quiet for obvious reasons tonight - out with friends and I've just wasted a couple of hours having seen "Ubuntu in Windows 10" which then turns out to be a beta, which then turns out to be very old and breaks when you upgrade it to the latest stable Ubuntu - I should know by now not to use Microsoft Betas - thanks Microsoft.

Right so coming up - a couple of new boards from FriendlySoft, one being 64 bits! and I'm looking forward to a new DIY Amazon Alexa - using Google's APIs - more on that in the new year.I'm just about to get to test my 250w solar panel having bought a couple of 12v 7amp batteries and an MTTP 20 amp controller - just waiting for some power converters to turn that 24v back into more useful 12v/5v. Assuming all goes well I'll write that up soon.

Awaiting new software for the Orange Pi Zero which is working well with Xenial and the new script (which seems to be fine now - no gripes for a day - if anyone has ideas for useful APT-gets to add in there do let us know (but only things that work rock-solidly and are genuinely useful please).

Lots more planned for the new year - for now - hope you all have a great evening.

Pete


Facebooktwittergoogle_pluspinterestlinkedin

RGB LED Animation

$
0
0

LED AnimationI was over enjoying a NYE drink at Aidan’s place at the weekend and we were chatting about gadgets, as you do and he’s made a little 3d printed enclosure that looks like a round home fire alarm box.. in the middle is a movement sensor (IR) and some slots all around. He was demonstrating it and said that he’d put a string of RGB LEDs on the board for status use and I said how nice it would be to give it some Echo-style animation.

That went off on a tangent and we ended up with some fancy animation using my ESP8266 code (Home control 2016). The software to do this has been around for a while – but not really used other than in my flashing Christmas candle referred to in an earlier blog.. in that code you can refer to a string of RGB lights up to 300 of them and do things like -  make the first 10 LEDs RED and pause for a second, then make the second 20 LEDs GREEN and wait for 5 seconds, clear the lot wait 1 second.  That will then continue to do that forever in a loop.

What has always been missing however is proper loops an loops within loops. Well, I fixed that tonight.

Using the normal topic/payload structure I’ve been testing on serial.

Here’s an example I have running in front of me in which I have a strip of 12 serial RGB LEDs.  4 come on in blue, then they go off, then the last 8 alternate between 4 greens and 4 reds, then 4 reds and 4 greens, several times before clearing and starting all over again.  As you can see there’s a loop in the middle of that.

{rgbstop}
{rgbstart:12,12}
{rgbadd:1,0,4,0,0,255,1000}
{rgbadd:1,0,4,0,0,0,10}
{rgbadd:2,8}
{rgbadd:1,4,4,0,255,0,10}
{rgbadd:1,8,4,255,0,0,90}
{rgbadd:1,4,4,255,0,0,10}
{rgbadd:1,8,4,0,255,0,90}
{rgbadd:3}
{rgbadd:1,0,12,0,0,0,1000}

This is now INCOMPATIBLE with earlier code so if you have something already running you’ll need to add a new first parameter (1) to keep compatibility.

The first command stops anything already running. The second sets up 12 LEDs on GPIO12 (count is the second parameter).

An example of a simple light up is the third instruction – code 1, from LED 0, light 4 LEDs in BLUE (0,0,255) for 1000ms.

Then go onto clear those LEDS and wait 10ms.

The new stuff comes in line 5 – command (2) – the loop. That says – here’s a loop (2) which will run 8 times.  More light changes after that then command (3) – end of loop.  Finally I clear all 12 lights and wait a second until starting all over again. That’s it – you can do loops within loops of course.

There is also a command 4 which means END – you’d only use that if you wanted to perform a series of loops and then stop permanently. That has no parameters.

Assuming you’ve used the latter and have a sequence which does whatever and then stops – it might be nice to store this in FLASH and recall it when needed. There are four non-volatile buffers available to store this information.

{rgbstore:X} where X is 0-3

You can play back any of these as below, again assuming in this case GPIO12 and 12 LEDs. Set X to be 0-3

{rgbrecall:X}
{rgbstart:12,12}

The above will play back a stored sequence immediately.

The code is in the usual place and available via the OTA – don’t forget the minor incompatibility. So this applies to version 1.7.5 of the software and onwards.

Facebooktwittergoogle_pluspinterestlinkedin

A Thermostat Weekend

$
0
0

As it happens, a few days ago, reader Antonio pointed me to a little ESP8266 Thermostat – well, some code for it anyway, using one of those little 120*180 displays.

ESP8266 statI’m not that partial to Arduino development but I grabbed the code and stuck it on my hardware. Some great ideas there – but the implementation using a rotary encoder left something to be desired – and the code doesn’t support MQTT – and minus temperatures messed the display up. Oh and it seems to be partly in Italian and partly in English. Oh and a good but not especially long-lasting sensor is sitting right next to warm electronics and a warm display.

Don’t get me wrong, a STERLING effort and no doubt it will go on to be very good – but it wasn’t quite what I was looking for. It certainly fired me up.

As you all by now know I’m an MQTT/Node-Red/Mobile phone kind of guy and so armed with my new knowledge of Node-Red Desktop I sat down with coffee this morning and started to put together some new thermostat code (as if I needed more). One of the things I really liked about the ESP code was the timing page you see above. I have 5 time zones per day which can be any temperature – different at the weekend – but not without it’s issues – what if the weekend is not your “special” time for example – and it needs lots of controls.

This on the other hand was simple. I got to thinking – but if it was on a touch screen you would not have all that selecting nonsense and what about replicating settings for every day and….

And so it was that I sat down with a gallon of coffee and did what I always do – plough in with the code long before I’ve put a plan together. Sometimes it works, sometimes it doesn’t. Hey, I’m a one-man team!

Well, this time it did and I’m chuffed, but before getting into this – a quick lesson on using TEMPLATES in Node-Red Desktop.

Templates are easy – pretty much you can make a web page in a template – you can even have includes and JQuery comes with the deal.  The problem I’ve always had in the past is getting stuff in and out of the template – the examples given really don’t help and I spent HOURS trying to get to grips with this.

Scargill's statWhen we were messing with buttons I got a lot of help from folk, most of it I understood, getting variables into the Template I most definitely did not – but it worked and now the light is coming on.  Remember the good old days of ASP programming and other server-side interpreted coding – you had this code on the server which was NOT in the same space as the code in the web page. Well, this is similar. 

The likes of msg.payload sits in Node-red along with global variables, context variables  etc. They do NOT reside in run-time Javascript on the web page and that had me going in circles for ages. Well, there is a way around it, digging through the code we ended up with for the buttons.

(function(scope){
     scope.$watch('msg', function(msg) {
         // do stuff in here with msg… which includes any part of msg, even arrays etc.
     });
})(scope);

So here we are on the web page – in a script tag – and we drop this in. I know – what the HELL is scope. I can’t tell you in detail but I can tell you it works!  As soon as you inject the normal Node-Red msg (entire) object into the template – where that comment is above, you can use the lot inside that function, calling javascript functions etc. Note that in typical examples elsewhere – inside that function you’d see the word data – and I’d previously then used “data.payload” etc – however, keeping the name the same (msg) makes it easier.

Along with the ability to fire out information back to Node-Red with this and similar..

ng-click="send({payload: 'hello world'})"

when buttons are pressed etc.. you now have full input and output to your web-page. With that realisation I started on my new little thermostat. The most COMPLICATED page is that of settings – and the project above that I really liked - got me started as gives you 24 settings every day of the week. FANTASTIC – but I had to make it easy. Now, it is REALLY easy. You can set up programs for the entire week in a minute.

Over on the right – you see my interpretation of this – yes, it works – I just don’t have a relay fastened up yet to DO something.

Ok –  the colours need to be more subtle – don’t be awkward – I only started this yesterday after a fear-filled, anaesthetic-devoid double-crown fitting at the dentists via a 90+ mile round trip. – yes, I AM brave though it nearly reduced me to tears – so bear that in mind before criticising my colour taste. The buttons are simply Angular buttons with png images inserted.

So – you can touch/click on any of the timings – or temperature, or day and using the up and down buttons (they’ll end up as left and right arrows) you can change the temperature from one of the presets for that time or the time slot you are playing with or the day. The black line under the relevant item will turn purple (for now).

Flow

If you want to replicate the setting on subsequent hours, press/touch the copy button as often as you need (auto-increment). If you want to replicate the LOT, click on the DAY and then on the copy button and you’ll start whizzing through the days (auto-increment), coping the entire 24-hour schedule across – you can then tweak bits later. When you are happy you’ve not messed anything up – press the save button.

Now this lot is simply stored in an array – 24*7 bytes plus 4 bytes for the temperatures – so as an array, stored on SD it takes up almost no room – by using a 2-level array you could EASILY expand this into different ZONEs – so as well as a DAY field you’d have a ZONE field and a copy operation would copy the whole lot to the next zone – etc etc. Seriously this is a DODDLE to set up.

Finally a cancel button…which simply restores the array from SD – that function is also called at power up to get the values in the first place. I could probably do with a timeout on saving to avoid the (admittedly small) write to SD on every change. Still – not something you’d do a lot of.

So now we have a non-volatile global array with all the info in (I jammed the temperature settings on to the end of the array) – a separate page will show the temperature with a nice pretty dial, let you change manually up and down that for a given time – what, 4 hours before reverting to auto? and of course you’d want to show the humidity and pressure – very important they are all super accurate so I’m thinking a single BME280 would do the lot for you!!!

And that’s it – the output of “process heat” is simply the required heat value, sent out every minute. I picked a minute – could be 5 minutes – if you are working with, say, an oil boiler you really don’t want to be changing things rapidly. You can use this value to display in another page as the “set” temperature and to compare with the REAL temperature to decide what to do with, say, a relay.  Options might include a manual override – which should time out after a couple of hours maybe – and maybe a longer-term override in case you want shopping or are away for a couple of days in which case you might want to go to the lowest setting (offset zero in the global array) for some period. Normally for manual override you’d simply ADD your override figure to the automatic figure – ie 2 degrees WARMER or COOLER. My next job will be to do a nice job of the main stat display page.

The main page will no doubt also feature the local weather forecast – again from a previous article. One could even add a complete week’s predictions with icons.

More on this in near future – here is the current FLOW for this (no support and it WILL change in time) so you can just drop it in into Node-Red. Aren’t you glad you adopted the latter!

Auto-learning

To do auto-learning I think I’d change this – instead of 4 fixed temperatures I’d allow arbitrary temperature between, say 14c and 26c for every time slot (could do that now)…

Now, given THAT you could maintain a separate array – and every time someone makes a manual change – this would added to the second array (initially zero in all values).  After, say 4 weeks, you could divide the array down by, say, 4 (so that X degrees updated on the same hour for all 4 weeks would show up as one change) – and merely ADD that to the main array – clearing the second array. That way the system would have learned from the last 4 weeks changes but be ready to adapt to another 4 weeks changes etc. That’s one way – without getting too silly about it can you think of a more USEFUL way of adapting?

Facebooktwittergoogle_pluspinterestlinkedin

New Day, New Dial

$
0
0

tmp27F6WHAT a day I’ve had – messing around with a supposed DIY Alexa that isn’t… and getting to grips with dials. I wasted a lot of time on this (sorry Dave) before finally grasping the solution.

Here is the LATEST short video (Jan-10-2016)

So – in the last blog entry we took a look at the NEW Thermostat – this article looks at an even newer GAUGE - top left corner of the stat on the right – instead of a simple node-red-dashboard level node to show the temperature I have a pretty new gauge. All working as well! Indeed it is so useful I’ve decided to separate this out as I’m sure many of you will have a use for one or more of these.  Don’t get hung up on it being a thermometer – you can use it for anything – humidity, speed – whatever – completely programmable.

Here is the link to the gauge code. Pretty impressive stuff – there are examples over there – but the trick is, importing them into Node-Red-Dashboard. So – there is a library – under downloads – all in one.  Grab that .JS file and in my case I put it in a directory called /home/pi/.node-red/public/myjs -  that’s where I keep my .js files and Node-Red is aware of this. I’ve covered this before.

Armed with that file – you need a Node-Red-Dashboard TEMPLATE. In this case I set the template size at 3x3.  According I adjusted a couple of settings in this gauge to 160 * 160. pretty much you need the JAVASCRIPT source code for the dial – you get that from the site – and you need a <canvas> block. I’ve also added in a little chunk from earlier code to capture input to the node – that is used to alter the dial. And that is pretty much it.  What I would LIKE to do is dynamically adjust the size of the dial to fit whatever node size you use but I’m not yet succeeded with that.

Anyway – here’s the code for the dial you see here – to be inserted into the template note node to replace the existing gauge – and don’t forget to load in that .js file and make the template 3x3.

<script type="text/javascript" src="/myjs/gauge.min.js"></script>
<script>

   (function(scope){
        scope.$watch('msg', function(msg) {
           gauge.value=msg.payload;
        });
 
    })(scope);
var gauge = new RadialGauge({
    renderTo: 'canvas-id',
    width: 160,
    height: 160,
    units: "Degrees C",
    title: "Thermometer",
    minValue: 10,
    maxValue: 30,
    majorTicks: [
        '10',
        '15',
        '20',
        '25',
        '30'
    ],
    minorTicks: 5,
    strokeTicks: true,
   highlights  : [
        { from : 10,  to : 15, color : '#8888ff' },
        { from : 15, to : 20, color :  '#88ff88' },
        { from : 20, to : 25, color :  '#ffff00' },
        { from : 25, to : 30, color :  '#ff8888' }
    ],

    colorPlate: "#fff",
    borderShadowWidth: 0,
    borders: true,
    needleType: "arrow",
    needleWidth: 2,
    fontTitleSize: 42,
    needleCircleSize: 14,
    needleCircleOuter: true,
    needleCircleInner: false,
    animationDuration: 500,
    animationRule: "linear"
}).draw();

gauge.value = 18;

</script>
<canvas id="canvas-id">
    
</canvas>

ToDo – reduce the grey box from a float to an integer with 2 digits and get a 7-segment font into that grey box.

Facebooktwittergoogle_pluspinterestlinkedin

A Fantastic Day

$
0
0

Scargill's ThermostatIt’s been a good day today.

Let me clarify that – a good day considering I’m in the Northeast of England, wishing I was in the south of Spain and currently freezing to death.

I got up far too early with ideas in my head about the Thermostat – to cut a long story short, I had some ideas about introducing status colours into the top part of the display to show when the stat is off automatic or in away mode – that went fabulously well as you can see on the right – the status colours show up if you go off automatic – making it much more obvious.  Preliminary Node-Red flow here - see previous blog about requirements.

In the meantime I had an email back from the fellow who wrote the CANVAS dial, I’d used the JavaScript control because I simply did not understand how to interact with the canvas inside a Node-Red Dashboard template. Suffice it to say I do now and I’ve some more upgrades in the background.  Exciting stuff and opens up a world of opportunities.

Incidentally – once again, yesterday set a record for views on the blog – so thanks to all the new readers in here – I trust you’re finding this interesting.

Meanwhile a boatload of post turned up for me including a mountain of ONION2 peripherals which I’ll blog as soon as I get a minute – and the new FriendlyArm A64 board. I’ve been working with Antonio (MrShark) on this on and off as the operating system that came with it was ancient. A long conversation for another time, suffice it to say that right now we have Xenial and my script running on it but a few mods are going to be needed to accommodate this powerful 64-bit SBC.

I ALSO got some tiny DC/DC convertors I’ve been waiting for. I’d originally planned to make up a 24 volt solar system for Spain and of course all my stuff runs on 5v or 12v – slightly less of a worry now I’m going down the 12v route (I have a very nice 12v 500w full sine wave invertor sitting in front of me) but these boards are CUTE – size of my thumb-end and take up to 30v in with variable output. Cheap, too.  https://www.aliexpress.com/item/20-pcs-Ultra-Small-Size-DC-DC-Step-Down-Power-Supply-Module-3A-Adjustable-Step-Down/32262311443.html?spm=2114.13010608.0.0.4iRhaN

DC-DC ConvertorsNow, they CLAIM 3amps, I don’t believe it but they were so cheap if they do 2amps I’ll be happy – however it just so happens I have a 1R resistor – so,  I may just test one to destruction – the worst that can happen is a smell of burning plastic on test. Just before giving up for the night - I set the output to 3v, input 30v supply and banged a 1r 10w resistor on the output - which rose slightly to 3.2v (hence 3.2 amps) and within 20 second the resistor was quite warm and the pcb I would say hot... but no very hot. I could see 2 amps coming out, yes....

As always some great comments in the various blog areas  - I need a system to star rate comments and make them available in a “most useful” list order… a lot of great info from some great people hidden away.

That and some really pretty microUSB THICK leads from Ebay and home-made soup for lunch, not a bad day at all. More tomorrow –I have high hopes for the FriendlyArm board – and it is cheap, too!

Facebooktwittergoogle_pluspinterestlinkedin

FriendlyArm NanoPi A64

$
0
0

NanoPi A64Don’t you love reviews that tell you all about a new product then leave you to discover the horrors all on your own. Well, this isn’t one of those reviews. But I will give you the spec, info as to how to get more  and importantly the issues I faced getting it working.

The FriendlyArm NanoPi A64 is as you might expect a 64-bit SBC. It looks lovely, is small, has 4 serial ports (you can only really use two as one is for debug, the other for Bluetooth), Gigabit Ethernet, WIFI, Bluetooth and more – here’s a partial list of features - more on their WIKI. OH and it is cheap at (in US dollars) $25 plus post.

Important specs:

  • Allwinner A64 quad-core Cortex A53
  • GPU Mali400MP2
  • 1GB DDR3 Ram
  • Gigabit Ethernet
  • WIFI + Audio + IR + USBx2
  • 5v @ 5A

So on the surface of it a fast 64-bit processor – what more could you want – and it is small and well made. You can buy an optional heatsink with fan – but there are no special pins to attach the fan to, unlike other products by the same company. No matter, it does not get warm enough to need the fan in my experience. Idling it gets "luke-warm" if that.

I could give you a lot of other technical information which most people would not understand or have time to read – so instead I will cut straight to the point.

If you check, operating systems for this includes Ubuntu Core and Ubuntu MATE.  No Debian, no Android… so, to some extent, that defeats the object of having the decent graphics chip as you’re surely less likely to use it as a media centre than if you had Android. Well, that would be my take anyway. I was disappointed not to see Debian but then that’s me. So I started off trying out the full Ubuntu Mate.

The download took an age and I have pointed out to FriendlyArm that they should take a look at how they make their file available – 8 hours to download an image is not very funny.  This would not normally bother me as I tend to look first at the Armbian and DietPi sites – but they have nothing for this board. You might think that an operating system tailored for other A64 systems like the PINE would be good – but no – won’t even boot - been there, tried that.

So Ubuntu Mate came up fine first time – and I set off running my script – which didn’t work – NPN would not install and neither would Apache. It turns out that ONE reason for this was not as you might expect, lack of support for 64 bit systems (though that could be an issue) but the fact that this was Ubuntu 15.4 – which is ancient.

With help from Mr Shark we set about upgrading this to 16.04 Xenial. Well, that took nearly a DAY and was definitely NOT fun. At the end of it, we had 16.04 running – but the Ubuntu equivalent of the APP store was empty. I installed Chromium without it, clicked on the shortcut and… nothing – it simply would not run. Weird.

I tried my script and MOSTLY everything worked. A couple of tweaks and all was well, but I was not happy about the Chromium issue. If that was bust, what else was bust?  I put the SD to one side and downloaded the much smaller Ubuntu CORE.

After downloading software for these boards you must issue a couple of resizing options – I’ve already suggested to FriendlyArm that this should be part of their start-up script – you don’t have to mess with this with the Raspberry Pi and could put off beginners. Same again – 15.4 version – oh, dear. Anyway…

I started the resize operation…

sudo umount /dev/sdx?
sudo parted /dev/sdx unit % resizepart 2 100 unit MB print
sudo resize2fs -f /dev/sdx2

in this case sdx translates to sda.

No sudo.  What!!?!?!?!

I went off and grabbed SUDO. I started again.

No parted.

I grabbed that, ran the instructions and resized the board. Not impressed.

This time the upgrade was not so successful with lots of errors appearing – now I KNOW there are Linux fanatics out there dying to say “but that’s part of the fun”.  No it ISN’T part of the fun. Writing code is part of the fun, not messing with something that should not be an issue.  It would be like buying a car and the engine is old and broken and the salesmen says “well, repairs are all part of the journey, don't worry”.

Determined not to be put off, I went back to the original SD and decided to remove the entire desktop environment as it was not needed anyway. Well, I can tell you that most of the information out there on doing this is SHITE. No matter how many commands I ran – and how many confirmations I got that Mate desktop was no longer there, when I rebooted, up came the graphical environment.  Eventually, with help from Anthony, I got rid of the lot.  I ran my script and – lovely – all working.

I came to back this up using WinDiskManager and “sorry – the image is bigger than the disk” – apparently not all 16GB disks are created equal.

It was at this point that I had my first attempt to do a live backup – hey – what did I have to lose. I’ll cut a long story short here as I got the sector numbers wrong in the first place…

dd if=/dev/mmcblk0 of=/dev/sda bs=1M count=15000 status=progress

So dd is a very well known Linux program if you’re into Linux – I’d heard of it but that’s it – so this was my first attempt. I had to get the image backed up onto my SD that would work, without going out and buying a larger SD just to see most of it going to waste.

So – IF means input file, OF means output file, 1M is the buffer size – in short if you miss that off, it takes longer to do the backup – and "status=progress" is relatively new and lets you see a moving count while copying instead of wondering if it was working or dead.

This, of course, is all highly discouraged – attempting a backup while the system is running is asking for the death penalty. As for the count – not only was it incorrect, it was a GUESS – I figured I needed to copy enough to cater for all working areas of the SD – but somewhat less than the actual size or I’d be no better off and the system would gripe about not enough room as does WinDiskManager.

For good measure I also added another command – just because I’d seen this used in the FriendlyArm literature after resizing a disk…. resize2fs /dev/sda2

Well, it was a bit of a long shot – I took out the original SD (mmcblk0) and put the new SD (which had been sitting in a USB holder and hence appeared as SDA  - and put the new SD in, applied power and….

Well, I was expecting nothing so as not to be disappointed – to my surprise – up came the prompt. I checked all of my programs and bingo – everything works.  I followed advice from Anthony who was being kept up to date and dumped an empty file called “forcefsck” into the outer directory (i.e. just created an empty file with Nano (the editor)). Rebooted – no error messages – job’s done!

So – am I happy? Yes, I now have a rather fast board to play with.  I contacted FriendlyArm to find out the status of their version of the GPIO control software to see if it is available for this board.  Erm, no.  That is going to make it a little difficult for Node-Red to control ports. Oh dear.

So would I recommend this to others? Only if you’re comfortable with what you have read here and hopefully find my efforts a bit on the amateur side. If you struggled with it – I suggest looking elsewhere or waiting for WAY more support to appear.

Some of these other-board manufacturers do a cracking job – many of these boards are well made, well priced and generally very professional, but I’m sorry, all those claims for I2c, SPi, GPIO etc. are MEANINGLESS to most of us unless backed up with good, working and tested software– at the very least this board needs an up to date version of Debian or Ubuntu complete with GPIO support and examples and right now that is not on offer. I know how I2c and PWM etc works, I know how to use it. I neither know nor in any ware care AT ALL how it is implemented in the operating system or how to implement it myself. Life is too short.

But give it time, if you’ve read my other reviews I’m usually quiet supportive. If you want more info – simply look up NanoPi A4, there is a ton of info on their WIKI.

Facebooktwittergoogle_pluspinterestlinkedin

The Pine 64

$
0
0

Pine 64Just a quicky this morning as I’m busy working on a LED for the thermostat control (thanks to some help from the author – I’m quite excited)  as well as bench-testing some NanoPi 64 and M3 units.

So what you see here is the Pine 64 – which, like the FriendlyArm NanoPi64 uses a quad-core 64-bit CPU. This particular board has 1GB RAM (max 2GB)and is missing the Bluetooth/WIFI module ( the pins on the right side).

I’m having trouble with this one – that is, seeing the point of it.  As the photo depicts it is BIG – chopped up you could easily fit three Orange Pi Zeros into the same space and at least 2 M3 boards (the ones behind).

So to be fair, it DOES have a beta (if you like using beta software) Android 7 available – I’ve installed it, it works but is not stunningly fast – no-where near as fast as a typical mobile phone for example) – and not too many board manufacturers can claim that (this release of Android won’t even start up on the NanoPi A64). So if a modern Android is your thing then, well, I guess you’ll find the board useful. There is also a WiringOP for it (GPIO) but I understand that is somewhat incomplete.

If Android is not your thing and you want to do some control stuff, I cannot think of any good reason to go for this rather than something like the much cheaper Orange Pi Zero or perhaps the M1 or M2.

Well, I said it would be a quicky. Oh and the chip gets hot – it needs a heatsink and there are no mounting holes around the processor to fit one.

So – the board with 1GB RAM is only $19 – that’s good right?  But then if you want the Bluetooth and WIFI that comes WITH several other boards, that’s another $10. Add shipping to the UK and you are now looking at $40. With the current atrocious conversion rate you could buy a Raspberry Pi 3 for that. Go for the 2GB version and you’ll looking at $50+

I’m thinking at the roughly $50 price range – perhaps the Odroid C2 wipes the floor with this? What do you think?

So – what did I miss? Why would one want one of these? Someone enlighten me… there have to be some plus points?

Right –back to fitting a LED to my thermometer gauge.

Facebooktwittergoogle_pluspinterestlinkedin

Some Background

$
0
0

Far too often in blogs like this we “assume” that everyone is following along, so for the sake of boring regular readers…. the background to much of what you will see in this blog, revolves around my home control project which started off using an Atmega1284 chip as a controller and Arduino and wireless as end-points, mutating over time into it’s current state where I use any Raspberry-Pi “compatible” board to run Node-Red and talk to ESP8266-based end-points by the MQTT protocol – most of the programming being in C and NodeJS as appropriate - and a need to understand how best to make use of available widgets for general home control, in the now widely-used Node-Red (thanks partly to it’s adoption by Raspberry Pi).

I’ve followed the fantastic Node-Red since the beginning as it seemed like a good contender for home control even before the original “ui” – a community addition, eventually absorbed into the main Node-Red project to become “desktop”.  To find out more about Node-Red and Node-Red Dashboard you can join the discussion group over at Google+

Within the desktop you have a “node” called “template” which can display simple web pages inside a window in the desktop and can accept inputs and send information from its output – a near-perfect “black box” if you like. The problem is understanding just exactly what you can and cannot do inside the template, how to display items inside the template and making sure such items scale appropriately.

This is part of the journey that some of us are on – and I’ve written several articles on this now in the blog here. I hope you find them useful.

Within Node-Red there is a file called settings.js (usually on a Pi or a machine you’ve set up with a Pi user, this would be located at /home/pi/.node-red/settings.js) and you can set directories for your own javascript and css. As Node-Red already has such directories I’ve chosen to standardize on mjs, mycss,myimages, myicons etc.. using this as the base:

httpStatic: '/home/pi/.node-red/public',

Javascript can then be accessed as /myjs/xxxx.js  etc

As one would normally use an 8GB or larger SD for such projects (smaller are often as expensive and sometimes hard to get) there is usually no shortage of space to store libraries of images, routines, css etc…  jQuery is already available inside the desktop without including it.

A good direction to go in (so it would seem) is to use widgets based on HTML5 Canvas. Keep an eye out for new widgets based on this and feel free to send us links to anything new and exciting.

Facebooktwittergoogle_pluspinterestlinkedin

RGraph with Node-Red

$
0
0

RGraph GaugeHaving gone from spending countless hours staring at HTML5 CANVAS, I’m now at the “meh” stage as it starts to dawn on my how it works.

And so it was that I stumbled on RGraph – or put another way, Christmas for widget-lovers.

If you’ve been following these blog entries you’ll know that Node-Red has TEMPLATES in the UI – and that you can put your own stuff into the templates and that recently the fog has lifted on getting variables in and out of the templates.

In recent blogs I’ve been constantly improving a thermostat control page and that took me off looking for a gauge with two pointers – one to show temperature, the other to show humidity.

And that’s when I stumbled upon RGraph. If you read this – and understand it – you will open the doors to a boatload of gauges, thermometers, charts and graphs so tuck in:

First things first, if you’ve already played with Node-Red in here you will likely have made a /myjs folder (home/pi/.node-red/public/myjs or similar – defined in your Node-Red settings.js file) to put various Javascript files in. Well, add this lot in a sub-folder called RGraph – you can call it freddy if you like but I thought it reasonable to use the name the way they use it. I grabbed the latest stable version from here. Inside there is a folder called RGraph – and inside that is a folder called libraries – I grabbed the contents of that folder and put it inside my /public/RGraph folder. It may be there is a use for other stuff in there – but for now that’s all I’ve taken.

So – then I dropped in a template – made it 6*6 and inside that template I put this lot – code shown below.

Now, if you don’t like my colours – change them. You can change just about anything including the size but you may need to adjust the font size if you do that. Experiment!

To change the two pointers – which I’ve chosen to call temperature and humidity – you might use them for petrol and oil – or whatever….I simply pass MSG as is common in Node-Red – but not msg.template – instead msg.temperature and msg.humidity – you can call them whatever you like.

The point of this is not to demonstrate my crap taste in colours – once you follow what I’ve done here – that entire, massive library of CANVAS-related gauges and charts is yours for the taking!  You can make the gauges interactive – but as I had two, not one pointers in this example, I skipped that. Details are in the extensive RGraph documentation.  Copy me and drop them an encouraging lines to say MORE IOT PLEASE!!

Oh and if you don’t like animation – where I say “grow” say “draw”.

(As an aside, I got this working today as well - https://www.codeproject.com/Articles/304874/HTML-Canvas-Aqua-Gauge)  very pretty but doesn’t scale well.

Prerequisites: Far too often in blogs like this we “assume” that everyone is keeping up – if not – may I suggest a quick look at this page I put up specifically to give a little background – which might help explain this article.

<script src="/myjs/RGraph/RGraph.common.core.js" ></script>
<script src="/myjs/RGraph/RGraph.gauge.js" ></script>

<script language="javascript" type="text/javascript">

           (function(scope){ 
                scope.$watch('msg', function(msg) {
                   gauge3.value=[msg.temperature,msg.humidity];
                   gauge3.grow();
                });
            })(scope);
            
            var gauge3 = new RGraph.Gauge({
                id: 'cvs',
                min: 0,
                max: 100,
                value: [23,60],
                options: {
                    titleTop: 'Temperature',
                    titleTopSize: '16',
                    titleTopFont: 'Impact',
                    titleTopColor: '#ff8888',
                    titleTopPos: 0.25,
                    titleBottom: 'Humidity',
                    titleBottomSize: '14',
                    titleBottomFont: 'Impact',
                    titleBottomColor: '#8888ff',
                    titleBottomPos: 0.3,
                    backgroundColor: 'black',
                    backgroundGradient: true,
                    centerpinColor: '#666',
                    needleSize: [null, 50],
                    needleColors: ['Gradient(transparent:yellow:orange:#ff8888:#ff8888)', 
                                    'Gradient(transparent:cyan:green:blue:blue)'],
                    textColor: 'white',
                    tickmarksBigColor: 'white',
                    tickmarksMediumColor: 'white',
                    tickmarksSmallColor: 'white',
                    borderWidth: 1,
                    borderOuter: '#666',
                    borderInner: '#3333',
                    colorsRanges: [
                                    [0,10,'rgba(0,0,255,0.6)'], 
                                    [10,20,'rgba(0,128,255,0.6)'], 
                                    [20,30,'rgba(0,255,255,0.6)'], 
                                    [30,40,'rgba(0,255,128,0.6)'], 
                                    [40,50,'rgba(0,255,0,0.6)'], 
                                    [50,60,'rgba(128,255,0,0.6)'], 
                                    [60,70,'rgba(255,255,0,0.6)'], 
                                    [70,80,'rgba(255,128,0,0.6)'],                                                                                                                                                 
                                    [80,90,'rgba(255,64,0,0.6)'],   
                                    [90,100,'rgba(255,0,0,1']
                                  ],
                    textAccessible: true
                }
            });
            gauge3.grow();

    </script>

    <canvas id="cvs" width="300" height="300">[No canvas support]</canvas>
 
Facebooktwittergoogle_pluspinterestlinkedin

SteelSeries and Node-Red

$
0
0

tmp768EYou should read the previous blog entry before this one – as the principles are the same as are some of the details such as the location of your /myjs folder for Node-Red – so read the other article first. This guage IMHO is the best yet!

To run the example on the right here you should get the SteelSeries library. 2 minified JS files is all you need.

See flow below… you will need the following incoming variables – all done for you in the example but of course you’ll want to customise…

msg.value   // the value of the pointer – in this case 0-100

msg.threshold // the value of the red threshold indicator

msg.userLed  // if true the green user LED will be flashing. You can turn this off if you don’t need it. I’ll use it to indicate a dehumidifier is running.

If the value is less than the threshold, the red LED will flash. This can be inverted in the code. If msg.userLed is true the green LED will be flashing.

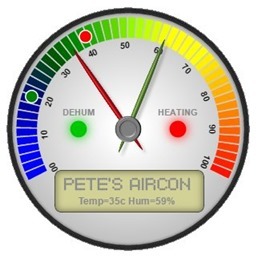
I’ve ALSO added as you can see separate ODOMETER (msg.odo - you could have LCD instead) and a trending UP/DOWN/STEADY/OFF  indicator and demo controls – discovering what is available on this gauge is half the battle!!

Everything is configurable, I’ve brought out what I think is useful – the rest is buried in steelseries.js which comes with the package – there is no documentation as such. All you need to store in your myjs library is steelseries-min.js and tween-min.js – but is it worth it? SURE IS  - this is a wonderful device… I can’t wait to get one on a nice large display on the wall.

I’m thinking general use to show temperature, odometer could show humidity, green user LED for dehumidifier on, RED light for heating on and the trending indicator to show maybe whether the heat is on the way up or down – though that much should be obvious from whether the heating is on or not… maybe a use I’ve not thought of yet. Or not – you can turn it off if you want. Wonderful.

flow

Prerequisites: Far too often in blogs like this we “assume” that everyone is keeping up – if not – may I suggest a quick look at this page I put up specifically to give a little background – which might help explain this article.

Looking for help: If anyone knows how to get rid of that chrome frame - DO let me know. frameVisible=false makes it hide but does not expand the gauge to fill in the space -in other words you are still left with an invisible frame - the only article I can find suggests this should not be the case - but it is. Given a small 3*3 frame size I'm after all the resolution I can get).

Here is my code for the example above (also available here):

[{"id":"8d862a4b.c1d588","type":"ui_template","z":"c552e8d2.712b48","group":"1e03a2b2.83a61d","name":"rgraph","order":1,"width":"6","height":"6","format":"<script src=\"/myjs/tween-min.js\"></script>\n<script src=\"/myjs/steelseries-min.js\"></script>\n<script>\nvar radial4;\n    (function(scope){ \n        scope.$watch('msg', function(msg) {\n           if (typeof(msg.value) != \"undefined\") radial4.setValueAnimated(msg.value);\n           if (typeof(msg.threshold) != \"undefined\") radial4.setThreshold(msg.threshold);\n           if (typeof(msg.odo) != \"undefined\")radial4.setOdoValue(msg.odo);  \n           if (typeof(msg.userLed) != \"undefined\") radial4.setUserLedOnOff(msg.userLed);  \n           if (typeof(msg.trend) != \"undefined\")\n            {\n                if (msg.trend==1)     radial4.setTrend(steelseries.TrendState.UP);\n                if (msg.trend==0)     radial4.setTrend(steelseries.TrendState.STEADY);\n                if (msg.trend==-1)    radial4.setTrend(steelseries.TrendState.DOWN);\n                if (msg.trend==-2)    radial4.setTrend(steelseries.TrendState.OFF);\n            }\n        });\n    })(scope);\n\n    var sections = [steelseries.Section(0, 25, 'rgba(0, 0, 220, 0.3)'),\n                        steelseries.Section(25, 50, 'rgba(0, 220, 0, 0.3)'),\n                        steelseries.Section(50, 75, 'rgba(220, 220, 0, 0.3)') ],\n\n            // Define one area\n    areas = [steelseries.Section(75, 100, 'rgba(220, 0, 0, 0.3)')],\n\n    radial4 = new steelseries.Radial('canvasRadial4', {\n            gaugeType: steelseries.GaugeType.TYPE4,\n            size: 292,\n            section: sections,\n            area: areas,\n            titleString: \"Heating\",\n            unitString: \"Degrees C\",\n            threshold: 50,\n            thresholdRising: false,\n            userLedVisible: true,\n            useOdometer: true,\n            lcdVisible: true,\n            trendVisible: true\n        });\n                        \n    radial4.setFrameDesign(steelseries.FrameDesign.BLACK_METAL);\n    radial4.setValueAnimated(0);\n    radial4.setThreshold(50);\n    radial4.blinkUserLed(0);\n    radial4.setOdoValue(0);\n\n\n</script>\n\n<canvas id=\"canvasRadial4\" width=\"401\" height=\"401\"></canvas>\n","storeOutMessages":true,"fwdInMessages":false,"x":490,"y":920,"wires":[[]]},{"id":"94d08897.6b6f78","type":"inject","z":"c552e8d2.712b48","name":"Set needle to 88","topic":"","payload":"88","payloadType":"num","repeat":"","crontab":"","once":false,"x":140,"y":700,"wires":[["a72af19d.e17e2"]]},{"id":"f5301eaa.f021d","type":"inject","z":"c552e8d2.712b48","name":"Set needle to 33","topic":"","payload":"33","payloadType":"num","repeat":"","crontab":"","once":false,"x":140,"y":740,"wires":[["a72af19d.e17e2"]]},{"id":"a72af19d.e17e2","type":"function","z":"c552e8d2.712b48","name":"","func":"msg.value=msg.payload;\nreturn msg;","outputs":1,"noerr":0,"x":310,"y":720,"wires":[["8d862a4b.c1d588"]]},{"id":"cb9d2598.de4918","type":"inject","z":"c552e8d2.712b48","name":"Set threshhold to 60","topic":"","payload":"60","payloadType":"num","repeat":"","crontab":"","once":false,"x":150,"y":780,"wires":[["d1f505b0.62c9f8"]]},{"id":"b50f3ae1.7cbdd8","type":"inject","z":"c552e8d2.712b48","name":"Set threshold to 30","topic":"","payload":"30","payloadType":"num","repeat":"","crontab":"","once":false,"x":150,"y":820,"wires":[["d1f505b0.62c9f8"]]},{"id":"d1f505b0.62c9f8","type":"function","z":"c552e8d2.712b48","name":"","func":"msg.threshold=msg.payload;\nreturn msg;","outputs":1,"noerr":0,"x":310,"y":800,"wires":[["8d862a4b.c1d588"]]},{"id":"cd9b1fe2.9c989","type":"inject","z":"c552e8d2.712b48","name":"Set user LED ON","topic":"","payload":"true","payloadType":"bool","repeat":"","crontab":"","once":false,"x":140,"y":861,"wires":[["199bc0e7.607eff"]]},{"id":"59205954.a730c8","type":"inject","z":"c552e8d2.712b48","name":"Setuser LED OFF","topic":"","payload":"false","payloadType":"bool","repeat":"","crontab":"","once":false,"x":150,"y":901,"wires":[["199bc0e7.607eff"]]},{"id":"199bc0e7.607eff","type":"function","z":"c552e8d2.712b48","name":"","func":"msg.userLed=msg.payload;\nreturn msg;","outputs":1,"noerr":0,"x":310,"y":881,"wires":[["8d862a4b.c1d588"]]},{"id":"f13cc85.7df0038","type":"comment","z":"c552e8d2.712b48","name":"Example use of Steelseries Gauge","info":"","x":180,"y":660,"wires":[]},{"id":"ffa9ff04.4fc7f","type":"inject","z":"c552e8d2.712b48","name":"Trend UP","topic":"","payload":"1","payloadType":"num","repeat":"","crontab":"","once":false,"x":120,"y":940,"wires":[["2320de53.8b2e42"]]},{"id":"3c6f1b6f.e42924","type":"inject","z":"c552e8d2.712b48","name":"Steady","topic":"","payload":"0","payloadType":"num","repeat":"","crontab":"","once":false,"x":110,"y":980,"wires":[["2320de53.8b2e42"]]},{"id":"2320de53.8b2e42","type":"function","z":"c552e8d2.712b48","name":"","func":"msg.trend=msg.payload;\nreturn msg;","outputs":1,"noerr":0,"x":310,"y":960,"wires":[["8d862a4b.c1d588"]]},{"id":"e0daa005.96fd5","type":"inject","z":"c552e8d2.712b48","name":"Down","topic":"","payload":"-1","payloadType":"num","repeat":"","crontab":"","once":false,"x":110,"y":1020,"wires":[["2320de53.8b2e42"]]},{"id":"893a4668.be5a78","type":"inject","z":"c552e8d2.712b48","name":"Off","topic":"","payload":"-2","payloadType":"num","repeat":"","crontab":"","once":false,"x":110,"y":1060,"wires":[["2320de53.8b2e42"]]},{"id":"a222fdf0.4934d","type":"inject","z":"c552e8d2.712b48","name":"ODO 50","topic":"","payload":"50","payloadType":"num","repeat":"","crontab":"","once":false,"x":120,"y":1100,"wires":[["f7bee9bf.d05478"]]},{"id":"7a3e24c1.17e7dc","type":"inject","z":"c552e8d2.712b48","name":"ODO 78.6","topic":"","payload":"78.6","payloadType":"num","repeat":"","crontab":"","once":false,"x":120,"y":1140,"wires":[["f7bee9bf.d05478"]]},{"id":"f7bee9bf.d05478","type":"function","z":"c552e8d2.712b48","name":"","func":"msg.odo=msg.payload;\nreturn msg;","outputs":1,"noerr":0,"x":310,"y":1120,"wires":[["8d862a4b.c1d588"]]},{"id":"1e03a2b2.83a61d","type":"ui_group","z":"","name":"testy","tab":"f9bab960.c839b8","disp":true,"width":"6"},{"id":"f9bab960.c839b8","type":"ui_tab","z":"","name":"testy","icon":"dashboard"}]
Facebooktwittergoogle_pluspinterestlinkedin

LCD Display for Node-Red

$
0
0

Pete's LCDAs must be obvious by now, I’m on a roll here. Having decided that Node-Red Dashboard is the way forward ( would in the past have used BLYNK or Imperihome) I’ve been getting to grips with the dashboard and as you’ll see if you check recent blogs I’ve had a fair bit of success with various CANVAS based libraries, getting them into the Dashboard.

And so it was that this morning MrShark contacted me with this link – a very nice stand-along clock display. Well, that fired me up and so I grabbed the code and started ripping it apart.  One thing led to another and here we have a nice LCD display – and in the process I learned a few things such as what position-absolute is all about and a great use for transparency.

Pete's LCDIn the display here you see the use of border shadows, 7-segment display fonts and transparency to give the impression of an old-fashioned LCD display – I think it does a nice job.  The code here displays the time, date and day automatically and you can inject temperature into it – but a brief look and you’ll soon realise that you could put just about anything in there – so I look forward to feedback from readers.  To make this work, from the link above I had to grab 3 fonts (DSEG7Modern-Italic.woff,  DSEG14Modern-Italic.woff and DSEG7Modern-BoldItalic.woff – I also grabbed Pete's LCDDSEGWeather.woff and have included it in the code but not used it – I’m sure someone will find a great use for this) from the link above (into myfonts – see previous blogs for the reason I made up directory names like myfonts and mycss).

So – here is the code to put into a Dashboard template – you just need to inject msg.payload to set the temperature. I did think of making that a little smaller so I could fit both temperature and humidity into it – why not have a play.

Pete's LCDThere are several spans in here – all position absolute – which means they overlap and are all relative to the top left of the main DIV – the trick with the LCD is simply the 8 figure semi-transparent – with you number or letter sitting on top of it. Works a treat I should say.  You’ll want a 6*2 size for the template… but of course you may choose to resize this completely.

<script>
    var daylist = ["sun", "mon", "tue", "wed", "thu", "fri", "sat"];
    (function(scope){ 
            scope.$watch('msg', function(msg) {
               if (typeof(msg.payload) != "undefined") $("#DSEGTemp").text(msg.payload);
               if (typeof(msg.colour) != "undefined") 
                            { 
                             if (msg.colour=="orange") $(".Clock-Wrapper").css('background-color', '#fb7c00');  
                             if (msg.colour=="green")  $(".Clock-Wrapper").css('background-color', '#66ac66');                              
                             if (msg.colour=="blue")   $(".Clock-Wrapper").css('background-color', '#8888ff');  
                             if (msg.colour=="yellow") $(".Clock-Wrapper").css('background-color', '#bbbb44');  
                             if (msg.colour=="white") $(".Clock-Wrapper").css('background-color', '#aaaaaa');  
                             if (msg.colour=="pink") $(".Clock-Wrapper").css('background-color', '#ff8888');  
                            }
            });
    })(scope);

    function genTimerStrings(tm, num){
    
    	var i;
    	var ret = tm.toString(10);
    	var left = ret.length;
    
    	if( left < num){
    		for(i=0; i<( num - left ); i++ ){
    			ret = String(0) + ret;
    		}
    	}
    	return ret;
    }

    function updateTimer(){
    	var ret;
    	var date = new Date();
    	var tm_year, tm_mon, tm_date, tm_hour, tm_min, tm_sec, tm_msec,tm_day;
    	var colon;
    	tm_year = date.getFullYear();
    	tm_mon = date.getMonth()+1;
    	tm_date = date.getDate();
    	tm_day = date.getDay();
    	tm_hour = date.getHours();
    	tm_min = date.getMinutes();
    	tm_sec = date.getSeconds();
    	tm_msec = date.getMilliseconds();
    
    	tm_mon = genTimerStrings(tm_mon, 2);
    	tm_date = genTimerStrings(tm_date, 2);
    	tm_hour = genTimerStrings(tm_hour, 2);
    	tm_min = genTimerStrings(tm_min, 2);
    	tm_sec = genTimerStrings(tm_sec, 2);
    	tm_day = daylist[tm_day];
    
    	if( tm_msec > 499 ){
    		colon = ' ';
    	}else{
    		colon = ':';
    	}
    
    	document.getElementById("DSEGClock").innerHTML = tm_hour + colon + tm_min + "<span style=\"font-size:30px;\">"  + tm_sec + "</span>";
    	document.getElementById("DSEGClock-Year").innerHTML = "<span class=\"D7MI\">" + tm_year + "-" + tm_mon + "-" + tm_date + ' ' + "</span><span class=\"D14MI\">" + tm_day  +  "." + "</span>";
    
    	setTimeout("updateTimer()", 500 - date.getMilliseconds()%500 );
    }

    updateTimer();
</script>

<style type="text/css">
.lcdClock {
	background-color:#fbfbfb;
	font-size:100%;
	padding-left:10px;
	padding-right:10px;
	padding-bottom:10px;
	max-width:300px;
	line-height:160%;
	color:#222;
	font-family:Meiryo, 'Lucida Grande','Hiragino Kaku Gothic ProN', sans-serif;
}

@font-face {
  font-family: "D7MI";
  src: url("/myfonts/DSEG7Modern-Italic.woff") format('woff');
}

@font-face {
  font-family: "D14MI";
  src: url("/myfonts/DSEG14Modern-Italic.woff") format('woff');
}

@font-face {
  font-family: "D7MBI";
  src: url("/myfonts/DSEG7Modern-BoldItalic.woff") format('woff');
}

@font-face {
  font-family: "DWEATHER";
  src: url("/myfonts/DSEGWeather.woff") format('woff');
}

.D7MI {
font-family: "D7MI";
}

.D7MBI {
font-family: "D7MBI";
}

.D14MI {
font-family: "D14MI";
}

.DWEATHER {
font-family: "DWEATHER";
font-size:72px;
height:72px;
}

.Clock-Wrapper{
	position:relative;
	border:6px solid #000;
	border-radius:9px;
	height:68px;
	width:280px;
	background-color:#fb7c00;
	background-color:#66ac66;

	box-shadow: 4px 4px 28px 0px rgba(0,0,0,0.3) inset; 
}

.Clock-Time-Background{
	z-index:50;
	color:rgba(0,0,0,0.15);
}

.Clock-Time-Front{
	z-index:100;
}

.Clock-Time-Background,.Clock-Time-Front {
   	position:absolute;
	top:38px;
	left:5px; 
	font-size:42px;
}

.Clock-Year-Background{
	z-index:50;
;
	color:rgba(0,0,0,0.1);
	font-size:18px;
}

.Clock-Year-Front{
	z-index:100;
}

.Clock-Year-Background,.Clock-Year-Front {
   	position:absolute;
	top:2px;
	left:5px; 
	font-size:18px;
}

.temp { z-index:100; }
.tempBack { z-index:50; color:rgba(0,0,0,0.1); }
.temp,.tempBack {
   	position:absolute;
	top:28px;
	left:210px; 
	font-size:42px;
}

.tempc { z-index:100; }
.tempcBack { z-index:50; color:rgba(0,0,0,0.1); }
.tempc,.tempcBack {
   	position:absolute;
	top:36px;
	left:278px; 
	font-size:24px;
}

#DSEG7_OUTPUT{
	font-family: "D7MI";
}

#DSEG14_OUTPUT{
	font-family: "D14MI";
}

#DSEG14_OUTPUT, #DSEG7_OUTPUT{
	font-size:18px;
	margin-top:2px;
	margin-bottom:10px;
}

</style>


<div class="Clock-Wrapper center lcdClock">
	<span class="Clock-Time-Background D7MBI">88:88<span style="font-size:30px;">88</span></span>
	<span id="DSEGClock" class="Clock-Time-Front D7MBI"></span>
	<span class="Clock-Year-Background"><span class="D7MI">2088-88-88</span><span class="D14MI"> ~~~</span></span>
	<span id="DSEGClock-Year" class="Clock-Year-Front"></span>
	
	<span id="DSEGTemp" class="temp D7MBI">41</span>
	<span id="DSEGTemp" class="tempBack D7MBI">88</span>	
	<span id="DSEGTempc" class="tempc D7MI">C</span>
	<span id="DSEGTempc" class="tempcBack D7MI">8</span>	
</div>

Facebooktwittergoogle_pluspinterestlinkedin

Another LCD

$
0
0

LCD colours by Peter ScargillWhen writing that last blog entry about an LCD with time and date display and programmable temperature for Node-Red Dashboard, it occurred to me that it would be worthwhile making a simple one-liner (6*1) LCD with a 20-character display. At the same time I wanted to simplify it right down and here’s the result. Should make a good starting point for anyone wanting to develop their own.

Flow

In this case you simply fire a message at the template node. You only need one font for this from the ones used in the previous entry (really you should read the previous article to understand how to load the fonts in – trivial).

I’ve done a check on msg.payload and if the first character is a period I then use the remainder of the message to select colour – hence…

.blackOnOrange
.blackOnGreen
.blackOnBlue
.blackOnYellow
.blackOnWhite
.blackOnPink
.yellowOnRed
.whiteOnCyan
.orangeOnBlack
.limeOnBlack

And that really is it – really simple to use – make the template 6*1,insert the code, make sure the font is in place and when you run it – you can select the sample text or play with the colours – enjoy.

LCD colours by Peter Scargill

LCD colours by Peter Scargill

LCD colours by Peter Scargill

[{"id":"7744e0e4.38986","type":"inject","z":"c552e8d2.712b48","name":"","topic":"","payload":"Hello there","payloadType":"str","repeat":"","crontab":"","once":false,"x":800,"y":1180,"wires":[["864d97a5.30d348"]]},{"id":"543d4cba.38a7a4","type":"inject","z":"c552e8d2.712b48","name":"green","topic":"","payload":".blackOnGreen","payloadType":"str","repeat":"","crontab":"","once":false,"x":790,"y":1220,"wires":[["864d97a5.30d348"]]},{"id":"658a2f15.d95bc","type":"inject","z":"c552e8d2.712b48","name":"orange","topic":"","payload":".blackOnOrange","payloadType":"str","repeat":"","crontab":"","once":false,"x":790,"y":1260,"wires":[["864d97a5.30d348"]]},{"id":"b60e3a3f.931078","type":"inject","z":"c552e8d2.712b48","name":"blue","topic":"","payload":".blackOnBlue","payloadType":"str","repeat":"","crontab":"","once":false,"x":790,"y":1300,"wires":[["864d97a5.30d348"]]},{"id":"62767df.a99d984","type":"inject","z":"c552e8d2.712b48","name":"yellow","topic":"","payload":".blackOnYellow","payloadType":"str","repeat":"","crontab":"","once":false,"x":790,"y":1340,"wires":[["864d97a5.30d348"]]},{"id":"ad983ec0.bd2ed","type":"inject","z":"c552e8d2.712b48","name":"white","topic":"","payload":".blackOnWhite","payloadType":"str","repeat":"","crontab":"","once":false,"x":790,"y":1380,"wires":[["864d97a5.30d348"]]},{"id":"a046dc0e.953ea","type":"inject","z":"c552e8d2.712b48","name":"pink","topic":"","payload":".blackOnPink","payloadType":"str","repeat":"","crontab":"","once":false,"x":790,"y":1420,"wires":[["864d97a5.30d348"]]},{"id":"8372ff69.e0a4c","type":"inject","z":"c552e8d2.712b48","name":"red and light text","topic":"","payload":".yellowOnRed","payloadType":"str","repeat":"","crontab":"","once":false,"x":820,"y":1460,"wires":[["864d97a5.30d348"]]},{"id":"5fcd3b1d.a64954","type":"inject","z":"c552e8d2.712b48","name":"cyan and white","topic":"","payload":".whiteOnCyan","payloadType":"str","repeat":"","crontab":"","once":false,"x":820,"y":1500,"wires":[["864d97a5.30d348"]]},{"id":"a81aab9f.8f78a8","type":"inject","z":"c552e8d2.712b48","name":"lime on black","topic":"","payload":".limeOnBlack","payloadType":"str","repeat":"","crontab":"","once":false,"x":810,"y":1540,"wires":[["864d97a5.30d348"]]},{"id":"864d97a5.30d348","type":"ui_template","z":"c552e8d2.712b48","group":"33279d5b.72b122","name":"LCD","order":0,"width":"6","height":"1","format":"<script>\n    var LCDColours={\n    \"blackOnOrange\": {items:[\"#222\",\"#fb7c00\"]},    \n    \"blackOnGreen\" : {items:[\"#222\",\"#66ac66\"]},\n    \"blackOnBlue\" : {items:[\"#222\",\"#8888ff\"]},\n    \"blackOnYellow\" : {items:[\"#222\",\"#bbbb44\"]},\n    \"blackOnWhite\" : {items:[\"#222\",\"#aaaaaa\"]},\n    \"blackOnPink\" : {items:[\"#222\",\"#ff8888\"]},\n    \"yellowOnRed\" : {items:[\"#ccaa22\",\"#aa2222\"]},\n    \"whiteOnCyan\" : {items:[\"#dddddd\",\"#227777\"]},\n    \"orangeOnBlack\" : {items:[\"#ff8800\",\"#000000\"]},  \n    \"limeOnBlack\" : {items:[\"#00cc55\",\"#000000\"]} \n    } ;\n\n   (function(scope){ \n            scope.$watch('msg', function(msg) {\n                if (typeof(msg.payload) != \"undefined\") \n                        {\n                            if (msg.payload.substring(0,1)!=\".\") $(\"#LCDTextBody\").text(msg.payload);  \n                            else\n                            {\n                              msg.payload=msg.payload.substring(1);\n                              $(\".LCDWrapper\").css('background-color', LCDColours[msg.payload].items[1]);  $(\".LCDTextFront\").css('color', LCDColours[msg.payload].items[0]); \n                              if (LCDColours[msg.payload].items[1]==\"#000000\") $(\".LCDTextBack\").css('color',\"rgba(255,255,255,0.15)\"); else  $(\".LCDTextBack\").css('color',\"rgba(0,0,0,0.1)\");                                \n                                \n                            }\n                        }   \n            });\n    })(scope);\n\n</script>\n\n<style type=\"text/css\">\n@font-face {\n  font-family: \"D14MI\";\n  src: url(\"/myfonts/DSEG14Modern-Italic.woff\") format('woff');\n}\n\n\n.LCDWrapper{\n\tposition:relative;\n\tborder:3px solid #000;\n\tborder-radius:8px;\n\theight:66px;\n\twidth:304px;\n\tcolor: 0;\n    font-family: \"D14MI\";\n\tbackground-color:#66ac66;\n\tbox-shadow: 3px 3px 10px 0px rgba(0,0,0,0.3) inset; \n}\n\n.LCDTextBack{\n\tz-index:50; color:rgba(0,0,0,0.1); \n}\n\n.LCDTextFront{\n\tz-index:51; color:rgba(0,0,0,1);\n}\n\n.LCDTextBack,.LCDTextFront {\n   \tposition:absolute;\n\ttop:3px;\n\tleft:6px; \n\tfont-size:18px;\n}\n\n</style>\n\n<div class=\"LCDWrapper\">\n\t<span class=\"LCDTextBack\">~~~~~~~~~~~~~~~~~~~~</span>\n\t<span class=\"LCDTextFront\" id=\"LCDTextBody\" ></span>\n\n</div>\n","storeOutMessages":false,"fwdInMessages":false,"x":990,"y":1320,"wires":[[]]},{"id":"8e623ee.81f9bc","type":"inject","z":"c552e8d2.712b48","name":"","topic":"","payload":"Goodbye","payloadType":"str","repeat":"","crontab":"","once":false,"x":800,"y":1140,"wires":[["864d97a5.30d348"]]},{"id":"33279d5b.72b122","type":"ui_group","z":"","name":"LCD Test","tab":"34cddaf3.8a9cd6","disp":true,"width":"6"},{"id":"34cddaf3.8a9cd6","type":"ui_tab","z":"","name":"testz","icon":"dashboard"}]
Facebooktwittergoogle_pluspinterestlinkedin

Dashboard Question Time

$
0
0

tmpA072I have shown in these pages several examples of getting data into a Node-Red Dashboard template…. and even how to get static information from button presses out of it.

But here’s the thing – I am getting no-where getting Javascript out of the template – i.e. the value of variables.

Here’s an example – a very nice gauge just like the ones that come with Node-Red Dashboard itself – except THIS one can be altered by finger or mouse.

<script src="/myjs/RGraph/RGraph.common.core.js"></script>
<script src="/myjs/RGraph/RGraph.common.dynamic.js"></script>
<script src="/myjs/RGraph/RGraph.semicircularprogress.js"></script>

<script>

   (function(scope){
scope.$watch('msg', function(msg) {
if (typeof(msg.payload) != "undefined") { ssp.value=msg.payload; ssp.grow(); }
});
})(scope);

    var ssp = new RGraph.SemiCircularProgress({
id: 'cvs',
min: 0,
max: 100,
value: 86,
        options: {
gutterTop: 10,
gutterBottom: 105,
gutterLeft: 10,
gutterRight: 10,
unitsPost: '%',
labelsCenterSize: 30,
labelsCenterValign: 'center',
labelsMinSize: 10,
labelsMinOffsetAngle:-0.1,
labelsMinOffsetx:0,
labelsMinOffsety:0,
labelsMaxSize: 10,
labelsMaxOffsetAngle:0.1,
labelsMaxOffsetx:0,
labelsMaxOffsety:0,
adjustable: true,
textAccessiblePointerevents: false,
colors: ['Gradient(white:#0a0)'],
anglesStart: RGraph.PI - 0.5,
anglesEnd: RGraph.TWOPI + 0.5
}
}).grow();

</script>

<canvas  id="cvs" width="300" height="200">
[No canvas support]
</canvas>

Isn’t that lovely.  A couple of inject nodes with two values, say 40 and 80 will let you move the dial around…. but – how to get that value BACK out when you physically move the dial.

I have of course tried what you might expact – ng-mouseup="send({payload: 'hello'}) – works with a fixed value– though it causes a brief “Naan” when pressed, the cause of which I’m unsure – but trying to pass back a Javascript variable (I want the VALUE of that gauge” produces “undefined” every time.

So – all you hot Javascript types…. how do we get a result???

Facebooktwittergoogle_pluspinterestlinkedin

Yet Another Gauge

$
0
0

tmp6CBFThis one has been long in coming because despite my quickly evolving knowledge of Javascript and Canvas, that last leap – getting variable information out of a canvas and back into Node-Red – has kept me on edge for a couple of days now.  Dave (DCEEJAY) pointed me to various solutions all of which failed for me but then this morning he came up with a winner. I’ll go into detail in this article.

The gauge is simple enough – very much like the ones that Node-Red Dashboard already has – but it is adjustable (hmm, that’s a thought – I have suggested the Node-Red guys add a tick option to make the existing gauges adjustable. For now – this is it.

So – this started off as one of the examples from RGraph – you’ll need to include those libraries as previously. So note that the units used (degrees C) can be changed to anything you want – percentage or whatever. That is in the setup and is the entry marked “unitsPost”.

We have the by now familiar function(scope) function which allows us to inject values into the gauge – in this case msg.payload sets the gauge value.

We also have a special function which returns variable “value” to Node-Red on mouse up. This is the piece of the puzzle that has kept me going for days.  We also have a function which occurs on mouse up that grabs the current gauge value and stores it in “value”.  In the template itself, I’ve un-ticked “pass through messages” so that clicking or touching the gauge returns the new value of the gauge  - but injecting values does NOT product an output.

Now why is that last point important. Well, put such a gauge up on your computer screen and also on a secondary screen or phone – and watch what happens. Adjust one and…. nothing – the OTHER screen shows no change – oh dear. You need to inject the output back into the input for this to happen and unless you un-tick that box – the gauge will disappear up it’s own bum! For reasons beyond me you can’t connect a template’s output back to it’s input – so I just use an empty function to do that – well, empty other than I take the opportunity to put the value under the function just for effect.

I’ve made this to fit a 6*4 block. You can make it smaller by adjusting the size of the canvas, the gutter offsets and font size – but I could only manage to get one on a given tab without some unexplained interaction so I left the gauge this size which is handy for fingers on a typical phone.

tmp25CC

A view of the code:

<script src="/myjs/RGraph/RGraph.common.core.js"></script>
<script src="/myjs/RGraph/RGraph.common.dynamic.js"></script>
<script src="/myjs/RGraph/RGraph.semicircularprogress.js"></script>

<script>
    var value=0;

    (function(scope){
        scope.$watch('msg', function(msg) {
               if (typeof(msg.payload) != "undefined") { ssp.value=msg.payload; ssp.grow(); }
        });
  
})(scope);

this.scope.action = function() {
    return value;
}
    
    var ssp = new RGraph.SemiCircularProgress({
        id: 'newgauge1',
        min: 0,
        max: 100,
        value: 86,
        options: {
            gutterTop: 2,
            gutterLeft: 20,
            gutterRight: 5,
            gutterBottom: 70,
            unitsPost: '°C',
            labelsCenterSize: 40,
            labelsCenterValign: 'center',
            labelsMinSize: 10,
            labelsMinOffsetAngle:-0.1,
            labelsMinOffsetx:0,
            labelsMinOffsety:0,
            labelsMaxSize: 10,
            labelsMaxOffsetAngle:0.1,
            labelsMaxOffsetx:0,
            labelsMaxOffsety:0,
            adjustable: true,
            textAccessiblePointerevents: false,
            colors: ['Gradient(#224499:white)'],
            anglesStart: RGraph.PI - 0.5,
            anglesEnd: RGraph.TWOPI + 0.5
        }
    }).grow();
  
ssp.canvas.onmouseup = function (e)
{
    var obj   = e.target.__object__;
    value=obj.value;
}  
 </script>

<canvas ng-mouseup="send({payload:action()})" class="knob" id="newgauge1" width="300" height="200">
    [No canvas support]
</canvas>

The actual flow for copying into Node-Red:

[{"id":"3cbe837a.faf1dc","type":"ui_template","z":"c552e8d2.712b48","group":"33279d5b.72b122","name":"controller","order":0,"width":"6","height":"4","format":"<script src=\"/myjs/RGraph/RGraph.common.core.js\"></script>\n<script src=\"/myjs/RGraph/RGraph.common.dynamic.js\"></script>\n<script src=\"/myjs/RGraph/RGraph.semicircularprogress.js\"></script>\n\n<script>\n    var value=0;\n\n    (function(scope){\n        scope.$watch('msg', function(msg) {\n               if (typeof(msg.payload) != \"undefined\") { ssp.value=msg.payload; ssp.grow(); }\n        });\n  \n})(scope);\n\nthis.scope.action = function() {\n    return value;\n}\n    \n    var ssp = new RGraph.SemiCircularProgress({\n        id: 'newgauge1',\n        min: 0,\n        max: 100,\n        value: 86,\n        options: {\n            gutterTop: 2,\n            gutterLeft: 20,\n            gutterRight: 5,\n            gutterBottom: 70,\n            unitsPost: '°C',\n            labelsCenterSize: 40,\n            labelsCenterValign: 'center',\n            labelsMinSize: 10,\n            labelsMinOffsetAngle:-0.1,\n            labelsMinOffsetx:0,\n            labelsMinOffsety:0,\n            labelsMaxSize: 10,\n            labelsMaxOffsetAngle:0.1,\n            labelsMaxOffsetx:0,\n            labelsMaxOffsety:0,\n            adjustable: true,\n            textAccessiblePointerevents: false,\n            colors: ['Gradient(#224499:white)'],\n            anglesStart: RGraph.PI - 0.5,\n            anglesEnd: RGraph.TWOPI + 0.5\n        }\n    }).grow();\n  \nssp.canvas.onmouseup = function (e)\n{\n    var obj   = e.target.__object__;\n    value=obj.value;\n}  \n </script>\n\n<canvas ng-mouseup=\"send({payload:action()})\" class=\"knob\" id=\"newgauge1\" width=\"300\" height=\"200\">\n    [No canvas support]\n</canvas>","storeOutMessages":true,"fwdInMessages":false,"x":940,"y":1880,"wires":[["5ea77ad6.1b8064","8dc0930c.a5aaf"]]},{"id":"ecf3d231.ddba3","type":"inject","z":"c552e8d2.712b48","name":"","topic":"","payload":"40","payloadType":"str","repeat":"","crontab":"","once":false,"x":770,"y":1880,"wires":[["8dc0930c.a5aaf"]]},{"id":"d9c0b1d6.35dbb","type":"inject","z":"c552e8d2.712b48","name":"","topic":"","payload":"80","payloadType":"str","repeat":"","crontab":"","once":false,"x":770,"y":1920,"wires":[["8dc0930c.a5aaf"]]},{"id":"5ea77ad6.1b8064","type":"debug","z":"c552e8d2.712b48","name":"","active":true,"console":"false","complete":"false","x":1130,"y":1880,"wires":[]},{"id":"8dc0930c.a5aaf","type":"function","z":"c552e8d2.712b48","name":"pass thru","func":"node.status({fill:\"blue\",shape:\"dot\",text:msg.payload});\n\nreturn msg;","outputs":1,"noerr":0,"x":940,"y":1940,"wires":[["3cbe837a.faf1dc"]]},{"id":"33279d5b.72b122","type":"ui_group","z":"","name":"LCD Test","tab":"34cddaf3.8a9cd6","disp":true,"width":"6"},{"id":"34cddaf3.8a9cd6","type":"ui_tab","z":"","name":"testz","icon":"dashboard"}]
Facebooktwittergoogle_pluspinterestlinkedin

Thermometers

$
0
0

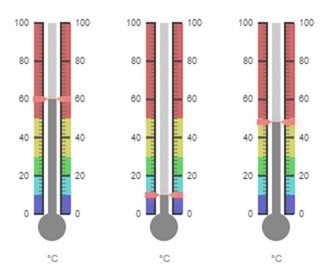
Thermometers for Node-Red

Three thermometers in a row for Node-Red (or as many or few as you like really) for Node-Red Dashboard. Another fine example of simple gauges and unlike some it is easy to make multiple gauges on one page – I will demonstrate three.

Here is the library source, I grabbed the larger one and saved as gauges-min.js in my /myjs folder – see previous blogs for setting this up with Node-Red.

Here is the code for one – and a flow example with three independent units.

You can of course alter the colours to whatever you want.

thermometer flow for Node-Red

The code for one template:

<script src="/myjs/gauge.min.js"></script>

<script>
  (function(scope){ 
            scope.$watch('msg', function(msg) {
               if (typeof(msg.payload) != "undefined") { gauge2.value=msg.payload; gauge2.draw(); }
            });
    })(scope);

var gauge2 = new LinearGauge({
    renderTo: 'mycanvas',
    valueBox: false,
    highlights: [ 
            {"from": 0, "to": 10, "color": "rgba(50, 50, 200, .75)"},
            {"from": 10, "to": 20, "color": "rgba(50, 200, 200, .75)"},
            {"from": 20, "to": 30, "color": "rgba(50, 200, 50, .75)"},
            {"from": 30, "to": 50, "color": "rgba(200, 200, 50, .75)"},
            {"from": 50, "to": 100, "color": "rgba(200, 50, 50, .75)"}
            ],
    barWidth: 10,
    units: "°C",
    borderShadowWidth: 0,
    borders: false,
    value: 35
}).draw();

</script>

<canvas id="mycanvas" 
    data-type="linear-gauge"
    data-width="106"
    data-height="270"
    data-units="°C"
    data-min-value="0"
    data-start-angle="90"
    data-ticks-angle="180"
    data-value-box="false"
    data-max-value="220"
    data-major-ticks="0,20,40,60,80,100,120,140,160,180,200,220"
    data-minor-ticks="2"
    data-stroke-ticks="true"
    data-color-plate="#fff"
    data-border-shadow-width="0"
    data-borders="false"
    data-needle-type="arrow"
    data-needle-width="2"
    data-needle-circle-size="7"
    data-needle-circle-outer="true"
    data-needle-circle-inner="false"
    data-animation-duration="1500"
    data-animation-rule="linear"
    data-bar-width="10"
    data-value="35"
></canvas>

The sample flow above

[{"id":"ddc888ba.e45578","type":"ui_template","z":"c552e8d2.712b48","group":"33279d5b.72b122","name":"controller","order":0,"width":"2","height":"5","format":"<script src=\"/myjs/gauge.min.js\"></script>\n\n<script>\n  (function(scope){ \n            scope.$watch('msg', function(msg) {\n               if (typeof(msg.payload) != \"undefined\") { gauge3.value=msg.payload; gauge3.draw(); }\n            });\n    })(scope);\n\nvar gauge3 = new LinearGauge({\n    renderTo: 'mycanvas2',\n    valueBox: false,\n    highlights: [ \n            {\"from\": 0, \"to\": 10, \"color\": \"rgba(50, 50, 200, .75)\"},\n            {\"from\": 10, \"to\": 20, \"color\": \"rgba(50, 200, 200, .75)\"},\n            {\"from\": 20, \"to\": 30, \"color\": \"rgba(50, 200, 50, .75)\"},\n            {\"from\": 30, \"to\": 50, \"color\": \"rgba(200, 200, 50, .75)\"},\n            {\"from\": 50, \"to\": 100, \"color\": \"rgba(200, 50, 50, .75)\"}\n            ],\n    barWidth: 10,\n    units: \"°C\",\n    borderShadowWidth: 0,\n    borders: false,\n    value: 35\n}).draw();\n\n</script>\n\n<canvas id=\"mycanvas2\" \n    data-type=\"linear-gauge\"\n    data-width=\"106\"\n    data-height=\"270\"\n    data-units=\"°C\"\n    data-min-value=\"0\"\n    data-start-angle=\"90\"\n    data-ticks-angle=\"180\"\n    data-value-box=\"false\"\n    data-max-value=\"220\"\n    data-major-ticks=\"0,20,40,60,80,100,120,140,160,180,200,220\"\n    data-minor-ticks=\"2\"\n    data-stroke-ticks=\"true\"\n    data-color-plate=\"#fff\"\n    data-border-shadow-width=\"0\"\n    data-borders=\"false\"\n    data-needle-type=\"arrow\"\n    data-needle-width=\"2\"\n    data-needle-circle-size=\"7\"\n    data-needle-circle-outer=\"true\"\n    data-needle-circle-inner=\"false\"\n    data-animation-duration=\"1500\"\n    data-animation-rule=\"linear\"\n    data-bar-width=\"10\"\n    data-value=\"35\"\n></canvas>\n","storeOutMessages":false,"fwdInMessages":false,"x":960,"y":2120,"wires":[[]]},{"id":"27cb8298.0e94de","type":"ui_template","z":"c552e8d2.712b48","group":"33279d5b.72b122","name":"controller","order":0,"width":"2","height":"5","format":"<script src=\"/myjs/gauge.min.js\"></script>\n\n<script>\n  (function(scope){ \n            scope.$watch('msg', function(msg) {\n               if (typeof(msg.payload) != \"undefined\") { gauge4.value=msg.payload; gauge4.draw(); }\n            });\n    })(scope);\n\nvar gauge4 = new LinearGauge({\n    renderTo: 'mycanvas3',\n    valueBox: false,\n    highlights: [ \n            {\"from\": 0, \"to\": 10, \"color\": \"rgba(50, 50, 200, .75)\"},\n            {\"from\": 10, \"to\": 20, \"color\": \"rgba(50, 200, 200, .75)\"},\n            {\"from\": 20, \"to\": 30, \"color\": \"rgba(50, 200, 50, .75)\"},\n            {\"from\": 30, \"to\": 50, \"color\": \"rgba(200, 200, 50, .75)\"},\n            {\"from\": 50, \"to\": 100, \"color\": \"rgba(200, 50, 50, .75)\"}\n            ],\n    barWidth: 10,\n    units: \"°C\",\n    borderShadowWidth: 0,\n    borders: false,\n    value: 35\n}).draw();\n\n</script>\n\n<canvas id=\"mycanvas3\" \n    data-type=\"linear-gauge\"\n    data-width=\"106\"\n    data-height=\"270\"\n    data-units=\"°C\"\n    data-min-value=\"0\"\n    data-start-angle=\"90\"\n    data-ticks-angle=\"180\"\n    data-value-box=\"false\"\n    data-max-value=\"220\"\n    data-major-ticks=\"0,20,40,60,80,100,120,140,160,180,200,220\"\n    data-minor-ticks=\"2\"\n    data-stroke-ticks=\"true\"\n    data-color-plate=\"#fff\"\n    data-border-shadow-width=\"0\"\n    data-borders=\"false\"\n    data-needle-type=\"arrow\"\n    data-needle-width=\"2\"\n    data-needle-circle-size=\"7\"\n    data-needle-circle-outer=\"true\"\n    data-needle-circle-inner=\"false\"\n    data-animation-duration=\"1500\"\n    data-animation-rule=\"linear\"\n    data-bar-width=\"10\"\n    data-value=\"35\"\n></canvas>\n","storeOutMessages":false,"fwdInMessages":false,"x":960,"y":2200,"wires":[[]]},{"id":"7df32c36.100ef4","type":"inject","z":"c552e8d2.712b48","name":"","topic":"","payload":"20","payloadType":"num","repeat":"","crontab":"","once":false,"x":770,"y":2100,"wires":[["ddc888ba.e45578"]]},{"id":"54305565.bdfd7c","type":"inject","z":"c552e8d2.712b48","name":"","topic":"","payload":"60","payloadType":"num","repeat":"","crontab":"","once":false,"x":770,"y":2140,"wires":[["ddc888ba.e45578"]]},{"id":"7907996d.21af38","type":"inject","z":"c552e8d2.712b48","name":"","topic":"","payload":"10","payloadType":"num","repeat":"","crontab":"","once":false,"x":770,"y":2180,"wires":[["27cb8298.0e94de"]]},{"id":"583f639c.99440c","type":"inject","z":"c552e8d2.712b48","name":"","topic":"","payload":"90","payloadType":"num","repeat":"","crontab":"","once":false,"x":770,"y":2220,"wires":[["27cb8298.0e94de"]]},{"id":"c8fdd54c.823418","type":"ui_template","z":"c552e8d2.712b48","group":"33279d5b.72b122","name":"controller","order":0,"width":"2","height":"5","format":"<script src=\"/myjs/gauge.min.js\"></script>\n\n<script>\n  (function(scope){ \n            scope.$watch('msg', function(msg) {\n               if (typeof(msg.payload) != \"undefined\") { gauge2.value=msg.payload; gauge2.draw(); }\n            });\n    })(scope);\n\nvar gauge2 = new LinearGauge({\n    renderTo: 'mycanvas',\n    valueBox: false,\n    highlights: [ \n            {\"from\": 0, \"to\": 10, \"color\": \"rgba(50, 50, 200, .75)\"},\n            {\"from\": 10, \"to\": 20, \"color\": \"rgba(50, 200, 200, .75)\"},\n            {\"from\": 20, \"to\": 30, \"color\": \"rgba(50, 200, 50, .75)\"},\n            {\"from\": 30, \"to\": 50, \"color\": \"rgba(200, 200, 50, .75)\"},\n            {\"from\": 50, \"to\": 100, \"color\": \"rgba(200, 50, 50, .75)\"}\n            ],\n    barWidth: 10,\n    units: \"°C\",\n    borderShadowWidth: 0,\n    borders: false,\n    value: 35\n}).draw();\n\n</script>\n\n<canvas id=\"mycanvas\" \n    data-type=\"linear-gauge\"\n    data-width=\"106\"\n    data-height=\"270\"\n    data-units=\"°C\"\n    data-min-value=\"0\"\n    data-start-angle=\"90\"\n    data-ticks-angle=\"180\"\n    data-value-box=\"false\"\n    data-max-value=\"220\"\n    data-major-ticks=\"0,20,40,60,80,100,120,140,160,180,200,220\"\n    data-minor-ticks=\"2\"\n    data-stroke-ticks=\"true\"\n    data-color-plate=\"#fff\"\n    data-border-shadow-width=\"0\"\n    data-borders=\"false\"\n    data-needle-type=\"arrow\"\n    data-needle-width=\"2\"\n    data-needle-circle-size=\"7\"\n    data-needle-circle-outer=\"true\"\n    data-needle-circle-inner=\"false\"\n    data-animation-duration=\"1500\"\n    data-animation-rule=\"linear\"\n    data-bar-width=\"10\"\n    data-value=\"35\"\n></canvas>\n","storeOutMessages":false,"fwdInMessages":false,"x":960,"y":2040,"wires":[[]]},{"id":"8cc2ade9.5db9b","type":"inject","z":"c552e8d2.712b48","name":"","topic":"","payload":"5","payloadType":"num","repeat":"","crontab":"","once":false,"x":770,"y":2020,"wires":[["c8fdd54c.823418"]]},{"id":"277f033f.43ecbc","type":"inject","z":"c552e8d2.712b48","name":"","topic":"","payload":"48","payloadType":"num","repeat":"","crontab":"","once":false,"x":770,"y":2060,"wires":[["c8fdd54c.823418"]]},{"id":"33279d5b.72b122","type":"ui_group","z":"","name":"LCD Test","tab":"34cddaf3.8a9cd6","disp":true,"width":"6"},{"id":"34cddaf3.8a9cd6","type":"ui_tab","z":"","name":"testz","icon":"dashboard"}]
Facebooktwittergoogle_pluspinterestlinkedin

What, ANOTHER Gauge?

$
0
0

Now, before you say anything – this gauge is different to the rest.. It is all mine and it EVOLVING if you’ve seen this blog entry before today…

Gauges: OPeter Scargill's Gaugek, I’ve spent much time ploughing through code, some of it years old (SteelSeries) and though beautiful,  not that well supported if at all and other libraries that are kitchen sink jobs that take some learning, so much so that this morning, in a fit of peak, after failing to figure out how to add a simple second dial or eliminate the wasted space of that metal outer ring in SteelSeries (it is easy to make it disappear but not the space it occupies) that I decided to “give it a go” myself.

What you see here is not finished but it works (and a lot prettier when you see it running).  It scales without internal adjustments other than the gauge size as I need something that will easily adapt to differing Node-Red template blocks.

There are several images on my site – don’t use them permanently please – grab them for yourself – they likely will change this week anyway.

As the dials move below the (circular) set-points the LEDS will go on and off – one triggers BELOW the set-point (heat), the other ABOVE (dehumidifier).

In the process of making this I’ve made a number of dials and centres – all in PowerPoint – very simple.

Centre 1 by Peter ScargillCentre 2 by Peter ScargillCentre 2 by Peter Scargill

I call these three metalCarvedCentre.png, greenCarveCentre.png and greyCentre.png respectively. I don’t plan to make a lot as there must be millions of needles and centres out there already.

Glowing rings are easy to add…

Glowing rings by Peter Scargill - in PowerPoint

If you poke the test values, you should see the gauge needles move smoothly to their destination. So I’m really happy about (and this happens a LOT it seems) having to update the whole thing every 20ms for animation when all I want is to update the dials (and an LCD panel eventually) – but I can’t find LAYERS anywhere – someone’s done a layering system but it looks awfully complicated. However, this does work and I note others simply redraw the lot for animation!

tmp42D9

A timer runs constantly but does nothing unless a change is made  and the values are then incremented or decremented until they  match the required values.

I think this will make a fine addition to the visual tools we have but still needs much tidying up so no comments about code quality please.

Fonts: Fonts are always a thing – and the normal web ones are today considered to be utterly pants. So – TTF fonts are good but also large – so I fount this online convertor. You simply drag a TTF file of your choosing (clearly if for commercial purposes, you need to make sure it is free) and you get the option to download from a link – it works. So I wanted a nice dot matrix font for the little display here – and I found “Dots all for Now JL” which is pretty but also 44K. I ran it through the convertor and in less than a minute I was up and running with a font that is only 7k.

To use the font, I did this..

<style type="text/css">
@font-face {
font-family: "DOTMAT";
src: url("/myfonts/dotsalfn.woff") format('woff');
}
</style>

and then just referred to DOTMAT as you would any font. Now there are all sorts of warnings on the web about ensuring fonts are loaded first and working with CANVAS etc. – but somehow, in Node-Red, it all just works… which is nice and keeps the code simple.

And that’s it for now. I’m working on improving the code.

[{"id":"22bad52a.82347a","type":"ui_template","z":"c552e8d2.712b48","group":"40cf30b4.d9549","name":"MyGauge","order":0,"width":"6","height":"6","format":"<style>\n  @font-face {\n    font-family: \"DOTMAT\";\n    src: url(\"/myfonts/dotsalfn.woff\") format('woff');\n  } \n</style>\n\n<script>\n  var showNeedle2 = true;\nvar showLED1 = true;\nvar showLED2 = true;\nvar needleWidth1 = 1;\nvar needleWidth2 = 1;\n\nvar set1 = 0;\nvar set2 = 0;\nvar value1 = 0;\nvar value2 = 0;\n\nvar setpoint1 = -1;\nvar setpoint2 = -1;\nvar degrees = -1;\nvar degrees2 = -1;\n\nvar title = \"Pete's Aircon\";\nvar subTitle = \"Hmm1\";\nvar ledTitle1 = \"DEHUM\";\nvar ledTitle2 = \"HEATING\";\n\nvar needle1 = new Image();\nvar needle2 = new Image();\nvar centre = new Image();\n\n\n\nvar direction1 = 1;\nvar direction2 = 1;\n\n(function(scope) {\n  scope.$watch('msg', function(msg) {\n    if (typeof(msg.value1) != \"undefined\") value1 = msg.value1;\n    if (typeof(msg.value2) != \"undefined\") value2 = msg.value2;\n    if (typeof(msg.set1) != \"undefined\") set1 = msg.set1;\n    if (typeof(msg.set2) != \"undefined\") set2 = msg.set2;\n  });\n})(scope);\n\n\n\n\nfunction n(n) {\n  return n > 9 ? \"\" + n : \"0\" + n;\n}\n\n\nfunction init() {\n  needle1.src = \"http://www.scargill.net/things/needles/redCurvedNeedle.png\";\n  needle2.src = \"http://www.scargill.net/things/needles/greenCurvedNeedle.png\";\n  centre.src = \"http://www.scargill.net/things/needles/greyCarvedCentre.png\";\n  canvas = document.getElementById(\"fred\");\n  ctx = canvas.getContext(\"2d\");\n  cX = Math.floor(canvas.width / 2);\n  cY = Math.floor(canvas.height / 2);\n  dX = cX / 175; // divisor for centrepiece sizing\n  dY = cY / 175;\n\n  setInterval(draw, 50);\n\n}\n\n// draw a wedge\nfunction drawWedge(percent, color, count) {\n  var arcRadians = ((percent / 100) * 360) * (Math.PI / 180),\n    startAngle = totalArc,\n    endAngle = totalArc - arcRadians;\n  ctx.save();\n  ctx.beginPath();\n  ctx.moveTo(cX, cY);\n  ctx.arc(cX, cY, radius_outer, startAngle, endAngle, true);\n  /** cut out the inner section by going in the opposite direction **/\n  ctx.fillStyle = color;\n  ctx.arc(cX, cY, radius_inner, endAngle, startAngle, false);\n  ctx.closePath();\n  ctx.fill()\n  ctx.restore();\n  totalArc -= arcRadians;\n}\n\nfunction drawbit(i, colr) {\n  if (i & 1) drawWedge(1.1, colr, i);\n  else drawWedge(0.2, \"#cccccc\", i);\n}\n\n// draw the donut one wedge at a time\nfunction drawDonut() {\n  var r, g, b;\n  b = 0;\n  g = 0;\n  r = 255;\n  for (var i = 0; i < 100; i++) {\n    var r, g, b;\n    if (i < 40) {\n      g += 8;\n    }\n    if ((i > 40) && (i < 70)) {\n      g -= 8;\n      r -= 12;\n    }\n    if (i > 70) {\n      g -= 8;\n      b += 12;\n    }\n    drawbit(i, \"rgba(\" + r + \",\" + g + \",\" + b + \",1)\");\n  }\n}\n\nfunction roundRect(ctx, x, y, width, height, radius, fill, stroke) {\n  if (typeof stroke == 'undefined') {\n    stroke = true;\n  }\n  if (typeof radius === 'undefined') {\n    radius = 5;\n  }\n  if (typeof radius === 'number') {\n    radius = {\n      tl: radius,\n      tr: radius,\n      br: radius,\n      bl: radius\n    };\n  } else {\n    var defaultRadius = {\n      tl: 0,\n      tr: 0,\n      br: 0,\n      bl: 0\n    };\n    for (var side in defaultRadius) {\n      radius[side] = radius[side] || defaultRadius[side];\n    }\n  }\n  ctx.beginPath();\n  ctx.moveTo(x + radius.tl, y);\n  ctx.lineTo(x + width - radius.tr, y);\n  ctx.quadraticCurveTo(x + width, y, x + width, y + radius.tr);\n  ctx.lineTo(x + width, y + height - radius.br);\n  ctx.quadraticCurveTo(x + width, y + height, x + width - radius.br, y + height);\n  ctx.lineTo(x + radius.bl, y + height);\n  ctx.quadraticCurveTo(x, y + height, x, y + height - radius.bl);\n  ctx.lineTo(x, y + radius.tl);\n  ctx.quadraticCurveTo(x, y, x + radius.tl, y);\n  ctx.closePath();\n  if (fill) {\n    ctx.fill();\n  }\n  if (stroke) {\n    ctx.stroke();\n  }\n}\n\nfunction drawCircle() {\n  ctx.save();\n  /** outer ring **/\n  ctx.beginPath();\n  ctx.moveTo(cX, cY);\n  ctx.shadowBlur = 5 * dX;\n  ctx.shadowColor = \"rgba(40,40,40,1)\";\n  ctx.arc(cX, cY, radius + (8 * dX), 0, 2 * Math.PI, false);\n  ctx.arc(cX, cY, radius + (6 * dX), 0, 2 * Math.PI, true);\n  ctx.closePath();\n  ctx.fillStyle = \"rgba(40,40,40,1)\";\n  ctx.fill();\n  ctx.restore();\n  \n  \n  // do an arc of numbers...\n   ctx.save();\n    ctx.translate(canvas.width / 2, canvas.height / 2);\n    ctx.rotate(-140 * (Math.PI / 180));\n    ctx.font = \"bold \" + String(Math.floor(cX / 13)) + \"px Helvetica\";\n    ctx.textAlign = 'center';\n    ctx.fillStyle = '#000000';\n    for (var a=0;a<=100; a+=10)\n    {\n    ctx.rotate(23 * (Math.PI / 180));\n    ctx.fillText(n(a), 0, -(cY*0.65)); \n    }\n    ctx.restore();\n  \n\n  ctx.save();\n\n  if (showLED1 == true) {\n    /** Sub label 1 **/\n    ctx.font = \"bold \" + String(Math.floor(cX / 14)) + \"px Helvetica\";\n\n    // ctx.font = \"bold \" + String(Math.floor(cX / 14)) + \"px Helvetica\";\n    ctx.textAlign = 'center';\n    ctx.fillStyle = '#8A8A8A';\n    ctx.fillText(ledTitle2, cX + (cX / 2.5), cY - (cY / 9), (cX / 1));\n    if (degrees < setpoint2) {\n      ctx.beginPath(); // red led - size and scale need to be related to canvas - currently fixed\n      ctx.arc(cX + (cX / 2.5), cY, (cX / 15), 0, 2 * Math.PI, false);\n      ctx.closePath();\n      ctx.shadowBlur = 20;\n      ctx.shadowColor = \"rgba(255,0,0,1)\";\n      ctx.fillStyle = \"rgba(255,0,0,1)\";\n      ctx.fill();\n      ctx.restore();\n    } else {\n      ctx.beginPath(); // red led - size and scale need to be related to canvas - currently fixed\n      ctx.arc(cX + (cX / 2.5), cY, (cX / 15), 0, 2 * Math.PI, false);\n      ctx.closePath();\n      ctx.fillStyle = \"rgba(140,40,40,1)\";\n      ctx.fill();\n      ctx.lineWidth = 2 * dX;\n      ctx.strokeStyle = 'rgba(40,0,0,0.6)';\n      ctx.stroke();\n      ctx.restore();\n    }\n  }\n  if (showLED2 == true) {\n    /** Sub label 1 **/\n    ctx.font = \"bold \" + String(Math.floor(cX / 14)) + \"px Helvetica\";\n    ctx.textAlign = 'center';\n    ctx.fillStyle = '#8A8A8A';\n    ctx.fillText(ledTitle1, cX - (cX / 2.5), cY - (cY / 9), (cX / 1));\n\n    if (degrees2 > setpoint1) {\n      ctx.save(); // green led - size and scale need to be related to canvas - currently fixed\n      ctx.beginPath();\n      ctx.arc(cX - (cX / 2.5), cY, (cX / 15), 0, 2 * Math.PI, false);\n      ctx.closePath();\n      ctx.shadowBlur = 20;\n      ctx.shadowColor = \"rgba(0,200,0,1)\";\n      ctx.fillStyle = \"rgba(0,200,0,1)\";\n      ctx.fill();\n      ctx.restore();\n    } else {\n      ctx.save(); // green led - size and scale need to be related to canvas - currently fixed\n      ctx.beginPath();\n      ctx.arc(cX - (cX / 2.5), cY, (cX / 15), 0, 2 * Math.PI, false);\n      ctx.closePath();\n      ctx.fillStyle = \"rgba(40,110,40,1)\";\n      ctx.fill();\n      ctx.lineWidth = 2 * dX;\n      ctx.strokeStyle = 'rgba(0,40,0,0.6)';\n      ctx.stroke();\n      ctx.restore();\n    }\n  }\n\n  /** Main label **/\n  ctx.save();\n\n  ctx.beginPath;\n  roundRect(ctx, cX - (cX / 1.7), cY + (cY / 3), cX + (cX / 5.1), cY - (cY / 1.5), dX * 10, true);\n  ctx.clip()\n\n  ctx.beginPath;\n  ctx.strokeStyle = 'black';\n  ctx.lineWidth = 5;\n  ctx.shadowBlur = 15;\n  ctx.shadowColor = 'black';\n  ctx.shadowOffsetX = 0;\n  ctx.shadowOffsetY = 0;\n  ctx.fillStyle = \"rgba(255, 255, 180, .8)\";\n  roundRect(ctx, cX - (cX / 1.7) - 4, cY + (cY / 3) - 4, cX + (cX / 5.1) + 8, cY - (cY / 1.5) + 8, dX * 10, true);\n\n  ctx.restore();\n  ctx.save();\n\n  ctx.font = \"bold \" + String(Math.floor(cX / 8)) + \"px DOTMAT\";\n  ctx.textAlign = 'center';\n  ctx.fillStyle = '#8A8A8A';\n  ctx.fillText(title, cX, cY + (cY / 2.05));\n\n  /** Sub label **/\n  ctx.font = \"bold \" + String(Math.floor(cX / 12)) + \"px Helvetica\";\n  ctx.textAlign = 'center';\n  ctx.fillStyle = '#8A8A8A';\n  ctx.fillText(subTitle, cX, cY + (cY / 1.65));\n  ctx.restore();\n}\n\nfunction draw() {\n\n  if ((set1 == setpoint1) && (set2 == setpoint2) && (value1 == degrees) && (value2 == degrees2)) return;\n\n  if (set1 > setpoint1) setpoint1++;\n  else if (set1 < setpoint1) setpoint1--;\n  if (set2 > setpoint2) setpoint2++;\n  else if (set2 < setpoint2) setpoint2--;\n\n  if (value1 > degrees) degrees++;\n  else if (value1 < degrees) degrees--;\n  if (value2 > degrees2) degrees2++;\n  else if (value2 < degrees2) degrees2--;\n\n\n  width = 18 * dX,\n    radius = cX * .9,\n    radius_outer = cX * .9,\n    radius_inner = (radius - width) - (11 * dX),\n    kerning = 0.04,\n    color_alpha = 0.3;\n  totalArc = .47; // starting point for the arc\n\n  ctx.save();\n  // Radii of the white glow.\n  innerRadius = 20 * dX;\n  outerRadius = canvas.height / 2;\n  gradient = ctx.createRadialGradient(canvas.width / 2, canvas.height / 2, innerRadius, canvas.width / 2, canvas.height / 2, outerRadius);\n  gradient.addColorStop(0, 'white');\n  gradient.addColorStop(1, '#bbbbbb');\n  ctx.arc(canvas.width / 2, canvas.height / 2, canvas.height / 2 - (10 * dX), 0, 2 * Math.PI);\n  ctx.fillStyle = gradient;\n  ctx.fill();\n  ctx.restore();\n\n  drawCircle();\n  drawDonut();\n  \n  // Humid Circle\n  ctx.save();\n  ctx.beginPath();\n  ctx.translate(canvas.width / 2, canvas.height / 2);\n  tdegrees = -204 + (degrees2 * 227 / 100)\n    ctx.rotate((233 / 100 * setpoint1 - 118) * (Math.PI / 180));\n    ctx.beginPath();\n    ctx.arc(0, -(cY*0.82),cY*0.05, 0, 2 * Math.PI, false);\n    ctx.fillStyle = 'green';\n    ctx.fill();\n    ctx.lineWidth = 1.5;\n    ctx.strokeStyle = '#ffffff';\n    ctx.stroke();\n  ctx.restore();\n\n  // Temperature Circle\n  ctx.save(); \n  ctx.beginPath();\n  ctx.translate(canvas.width / 2, canvas.height / 2);\n  tdegrees = -204 + (degrees2 * 227 / 100)\n  ctx.rotate((233 / 100 * setpoint2 - 118) * (Math.PI / 180));\n  //ctx.beginPath();\n    ctx.arc(0, -(cY*0.82),cY*0.05, 0, 2 * Math.PI, false);\n    ctx.fillStyle = 'red';\n    ctx.fill();\n    ctx.lineWidth = 1.5;\n    ctx.strokeStyle = '#ffffff';\n    ctx.stroke();\n  ctx.restore();\n\n  // Save the current drawing state\n  ctx.save();\n  ctx.beginPath();\n  ctx.translate(canvas.width / 2, canvas.height / 2);\n  tdegrees = -204 + (degrees * 227 / 100)\n  ctx.rotate(tdegrees * (Math.PI / 180));\n\n  // shadow on lines??\n  ctx.shadowBlur = 4;\n  ctx.shadowColor = \"rgba(0,0,0,0.2)\";\n  ctx.shadowOffsetX = 5 * dX;\n  ctx.shadowOffsetY = 5 * dX;\n\n\n  ctx.drawImage(needle1, (canvas.width / 7) - (canvas.width / 4), -(canvas.height * needleWidth1 / 80), (canvas.height / 2), (canvas.width * needleWidth1 / 40));\n  // Restore the previous drawing state\n  ctx.restore();\n\n  if (showNeedle2 == true) {\n    // Save the current drawing state\n    ctx.save();\n    ctx.beginPath();\n    ctx.translate(canvas.width / 2, canvas.height / 2);\n    tdegrees = -204 + (degrees2 * 227 / 100)\n    ctx.rotate(tdegrees * (Math.PI / 180));\n    // shadow on lines??\n    ctx.shadowBlur = 4;\n    ctx.shadowColor = \"rgba(0,0,0,0.2)\";\n    ctx.shadowOffsetX = 5 * dX;\n    ctx.shadowOffsetY = 5 * dX;\n    ctx.drawImage(needle2, (canvas.width / 7) - (canvas.width / 4), -(canvas.height * needleWidth2 / 80), (canvas.height / 2), (canvas.width * needleWidth2 / 40));\n    ctx.restore();\n  }\n  ctx.save();\n  ctx.beginPath();\n  ctx.translate(canvas.width / 2, canvas.height / 2);\n  // draw the centre bit then restore the previous drawing state\n  ctx.drawImage(centre, (0 - (centre.height / 4)) * dX, (0 - (centre.width / 4)) * dY, (centre.height / 2) * dX, (centre.width / 2) * dY);\n  ctx.restore();\n  subTitle = \"Temp=\" + n(Math.floor(degrees)) + \"c \" + \"Hum=\" + n(Math.floor(degrees2)) + \"% \";\n}\n\ninit();\n\n</script>\n\n<canvas id = \"fred\"\nwidth = 310 height = 310 > </canvas>","storeOutMessages":true,"fwdInMessages":true,"x":980,"y":2480,"wires":[[]]},{"id":"fbecd5a1.989ac8","type":"inject","z":"c552e8d2.712b48","name":"","topic":"","payload":"22","payloadType":"str","repeat":"","crontab":"","once":false,"x":630,"y":2340,"wires":[["9f9e89fe.db3518"]]},{"id":"6e98eeac.504cf","type":"inject","z":"c552e8d2.712b48","name":"","topic":"","payload":"35","payloadType":"str","repeat":"","crontab":"","once":false,"x":630,"y":2380,"wires":[["9f9e89fe.db3518"]]},{"id":"9f9e89fe.db3518","type":"function","z":"c552e8d2.712b48","name":"msg.value1","func":"msg.value1=msg.payload;\nreturn msg;","outputs":1,"noerr":0,"x":790,"y":2360,"wires":[["22bad52a.82347a"]]},{"id":"10d0f056.a552e","type":"inject","z":"c552e8d2.712b48","name":"","topic":"","payload":"11","payloadType":"str","repeat":"","crontab":"","once":false,"x":630,"y":2420,"wires":[["9eb8ebf8.be3108"]]},{"id":"ae37427b.2f8b3","type":"inject","z":"c552e8d2.712b48","name":"","topic":"","payload":"60","payloadType":"str","repeat":"","crontab":"","once":false,"x":630,"y":2460,"wires":[["9eb8ebf8.be3108"]]},{"id":"9eb8ebf8.be3108","type":"function","z":"c552e8d2.712b48","name":"msg.value2","func":"msg.value2=msg.payload;\nreturn msg;","outputs":1,"noerr":0,"x":790,"y":2440,"wires":[["22bad52a.82347a"]]},{"id":"2251f312.3a575c","type":"inject","z":"c552e8d2.712b48","name":"","topic":"","payload":"10","payloadType":"str","repeat":"","crontab":"","once":false,"x":630,"y":2500,"wires":[["7c5ad2de.3c767c"]]},{"id":"ae3f6f46.2aed8","type":"inject","z":"c552e8d2.712b48","name":"","topic":"","payload":"20","payloadType":"str","repeat":"","crontab":"","once":false,"x":630,"y":2540,"wires":[["7c5ad2de.3c767c"]]},{"id":"7c5ad2de.3c767c","type":"function","z":"c552e8d2.712b48","name":"msg.set1","func":"msg.set1=msg.payload;\nreturn msg;","outputs":1,"noerr":0,"x":780,"y":2520,"wires":[["22bad52a.82347a"]]},{"id":"4a2ac4f5.5906dc","type":"inject","z":"c552e8d2.712b48","name":"","topic":"","payload":"30","payloadType":"str","repeat":"","crontab":"","once":false,"x":630,"y":2580,"wires":[["f6ffef5f.562ca"]]},{"id":"8f5b3775.03c018","type":"inject","z":"c552e8d2.712b48","name":"","topic":"","payload":"40","payloadType":"str","repeat":"","crontab":"","once":false,"x":630,"y":2620,"wires":[["f6ffef5f.562ca"]]},{"id":"f6ffef5f.562ca","type":"function","z":"c552e8d2.712b48","name":"msg.set2","func":"msg.set2=msg.payload;\nreturn msg;","outputs":1,"noerr":0,"x":780,"y":2600,"wires":[["22bad52a.82347a"]]},{"id":"40cf30b4.d9549","type":"ui_group","z":"","name":"testa","tab":"66a97521.af8dac","disp":true,"width":"6"},{"id":"66a97521.af8dac","type":"ui_tab","z":"","name":"testa","icon":"dashboard"}]
Facebooktwittergoogle_pluspinterestlinkedin

HTML Canvas Touch Position

$
0
0

CanvasI’ve had some great fun the last few days working on my gauge – and as part of that I thought at one time of making it touch-sensitive. Thankfully my senses prevailed in the end but not before coming to terms with a need to understand how the HTML5 Canvas works.

If you’ve not played with this I highly recommend it. Great fun and just SO, SO very much better than computer-destroying FLASH.

Of course, many developers are well familiar with Canvas - but I wasn't - and yet it is essentially easy.  So I thought I'd jot down mouse stuff in case I need it in future - or someone else needs it.

So what you see upper right (just an image in this case) is a canvas area.  You can make an empty HTML page with nothing more than this in it..

<script>
#myCanvas {
background-color: rgba(158, 167, 184, 0.2);
}
</script>

<canvas id="myCanvas" width=350 height=350></canvas>

The first half is optional and is just to give the script a background colour so you can SEE it !!!

The second half defines a canvas area 350px square with the name (id) “myCanvas” – call it anything you like. Armed with that, in my gauge I have a nice curved set of blocks indicating 0-100 degrees.  I read up how to get the mouse position on "mouse up" – easy enough  - in a call-back function– you’ll see that in the jsFiddle code link below – you can play with this to your heart’s content in a browser.

My problem was – how do I convert that X/Y coordinate pair into something that tells me which part of the temperature curve I was in when I clicked the mouse!!! At that point I almost recoiled into my beer so I rang up my pal Peter Oakes in Canada who reminded me that 50 years ago at school I did algebra – and they rammed the sine rule into us.  It didn’t take long for it all to come back.  Reference the CENTRE of that canvas, any position is in one of 4 squares… and so depending which square the mouse is in, you can draw a right angled triangle from the mouse back to the centre and up (or down) to it’s X position.  Using a simple calculation you can then determine the angle up to 90 degrees. Again depending which of the four squares you are in – that totals up to 360 degrees – i.e. a circle. A little division as my gauge isn’t totally circular and I ended up with a value 0-100.

As it happens I didn’t need this but I’m sure anyone experimenting for the first time with Canvas interaction will find it useful – so here it is. Click in the area in the demo and you’ll see the angle and the X,Y coordinates of the mouse.

Now using the coordinates of the centre of the rectangle and comparing to X and Y you could then define a narrow curved band in which you are interested in accepting values – or not. I left that out so as to keep things simple.

In this case touch and mouse are interchangeable.

And just for good measure I added a pretty text gradient.

Let me in parting say this – my first few days of using Canvas were gruelling – and interacting with Node-Red even worse. With help from various people, all of that melted away and in my blog entries here you’ll see how to do the interaction. Now, I’m ready to go with Canvas, if you look at the last blog entry you’ll see I’ve tackled lots of things including text at arbitrary angled positions, arcs, inward shadows… slowly but surely it all comes together if you drink enough coffee.

https://jsfiddle.net/scargill/t296zh9j/7/

Facebooktwittergoogle_pluspinterestlinkedin

The Mint Experiment

$
0
0

Anyone who’s known me for years knows I’m a died in the wool Windows man.  Over many years from Windows 3.1 onwards, I’ve done down that road until ultimately all my machines are now Windows 10 – and I have to say that, while it could be argued before Windows 7 that it was not the most reliable operating system in the world, from that point on pretty much all of that changed. I regularly leave Windows 10 machines running for weeks on end and I’m sure they’d keep going for many months if it were not for the only remaining issue- that of pesky updates which Microsoft are determined we have whether we like it or not.

Now to be fair there was a time when Adobe – a company I cannot stand, used to issue updates for Acrobat almost on a daily basis and at least that no longer happens. I can usually tell when Windows wants me to update because Skype conversations become almost unusable and other strange things happen – at that point I reboot the machine and lo and behold – a Windows update is in progress – don’t turn off your machine. Thanks – I’m in a hurry for  train…

In my previous role as IT Director of the FSB, I would take it upon myself, being a hands-on type, from time to time, to try the latest Linux on one of our PCs, only to end up with utter disappointment as it would fail to connect to a WIFI access point or the video would hang over the end or some such issue – there was always SOMETHING – and so I would scrap that idea for a several months before trying again. At one point I used to get hate mail from  members who were clearly selling Linux machines -  for supporting Microsoft! Serious hate mail.  So over the years I kept trying again and always ending up with disappointment. (I’ve never used Linux on my personal machines because yes, I do like the latest state of the art, graphically intensive games and yes I do use lots of proprietary packages such as Magix and others which are simply not available on Linux.

In recent times as regular readers know, I’ve been forced into taking an interest in Linux because Debian (a Linux variation) runs on the Raspberry Pi. 2 years ago I bought a Raspberry Pi 2 (having played with the original Pi, loaded up the graphical operating system and immediately put it on Ebay in disgust at the speed). On the Pi2, I was pleasantly surprised to see that Raspbian ran at a reasonable speed and since then I’ve done many different board reviews and installed Raspbian and Debian on lots of boards, leaning on experts along the way as my knowledge started to build.

A while back I took the plunge and installed Ubuntu onto one of these boards and with help from others soon came to realise that there were not THAT many differences between Debian and Ubuntu and one of the things that has struck me in all this time is how reliable the operating system can be – I’ve a Pi that’s been sitting controlling stuff for well over a year now without as much as a sneeze despite me poking live updated and tweaks into it without rebooting.

Linux Mint on an old Dell laptop

And so with that in mind, last week I took an old DELL E4300 I had lying around which had simply refused to update to Windows 10 from Windows 7 (no matter how many ways I came at it) and which was so old it was really not worth opening up – and grabbed myself a USB stick with Ubuntu on it, ready after maybe 3 years of abstinence and armed with much better knowledge than previously, to try again.

Well, what a disappointment that was. Ubuntu loaded up no problem, with it’s rather dated looking purple interface – and asked me for my WIFI password – I promptly gave it this – and before long I had a working laptop. Or so I thought. The WIFI icon looked broken – yet I could pull up a browser and go on the web  - no problems. I was impressed by the ability to watch video on the BBC website, something that in the past on Linux was just not on.

tmp95E7That enthusiasm lasted maybe an hour. The App store decided not to work – coming up blank. But hey, that was just one program. I noted a nice graphical email client complete with calendar. I set it up and within minutes I had my Google calendar up and running. But as soon as I tried putting in email  - “Cannot get email as there is no Internet connection”. I opened a browser and sure enough the Internet was fine – but still that broken WIFI indicator. From there, things went downhill – it could not store draft emails due to a permissions issue and – nope – sorry life is TOO SHORT FOR THIS – I was reminded of the frustration of previous years… what HAVE these Linux guys being doing all this time, I thought.

I was in the process of giving up when I read something about Linux MINT. I liked the interface. In the instructions for installation I had to go get PendriveLinux so I could install the image on a USB stick. You should be seeing links here as appropriate. I went off to the official download page and picked the 64 bit version using the Xfce graphical interface as it had been suggested that while simple out of the box, this version had lots of options. I put the Mint Linux onto the USB stick and put it into the laptop. I must admit I found a certain satisfaction in wiping Ubuntu. The installation went well and WIFI came up but this time, no broken WIFI indicator. The taskbar seemed to be missing a battery indicator but It didn’t take me long to figure out how to add all sorts of widgets to the taskbar to make me feel at home (including a battery indicator).

I noted that Thunderbird email was installed and I set that up with my two email accounts – no problem whatsoever… but no calendar. Of course, that’s a plug in and it needs another plug-in to get Google calendar functionality – but all of that took mere moments to organise and now I have fully fledged email and calendar. Granted it is a little slow at pulling in the 35,000 emails in my main in-box – but it’ll get there I’m sure.

I hit a few obstacles on the way - my by now standard VNC server would not have it until Mr Shark suggested I try  x11VNC – that worked a treat.  Then I had it asking pesky password questions every time I tried to breath – that was easy to fix  - then I noted on power up that the KEYRING wanted another password – you’d think I was operating a bank. That went quickly – and from there everything went smoothly.  But this was Linux MINT – about which I know nothing at all. The funny thing was, doing an APT-GET UPDATE showed that in fact this is Ubuntu Xenial… now I’d already, with lots of help from MrShark, modified my all-singing install script for Ubuntu. I didn’t really expect it to work on this machine but having written down the steps to put everything together I thought “what the hell” and ran the script – it failed of course as it looks for UBUNU, DEBIAN, RASPBIAN or DIETPI – and this was LINUXMINT. I added a check for the latter THOROUGHLY expecting a host of horrific error and compatibility errors.

I was with some delight that I returned 15 minutes later to find that not only had the script worked – but without a single error – adding NodeJS, Node-Red, Apache, PHP 7, Mosquitto, SQLITE, MC and several other programs to my installation.  I rebooted to ensure I wasn’t dreaming – sure enough – everything worked.

The laptop has no Bluetooth interface so I plugged in one of those cheap Chinese Bluetooth USB units… and went off to the Bluetooth controls – without ANY hassle my Bluetooth mouse connected!!! I plugged in my Bluetooth headset – it got that – I went off to the BBC website and…news.bbc.co.uk – the Bluetooth headset didn’t connect automatically – so I went to the volume control – it was in the options – sure enough – perfectly synced Bluetooth.

Now if SKYPE video will just work….

Up to now, hours later, I have a nicely usable laptop with all my development toys (well maybe not NotePad++ but there are a couple of decent Linux editors,  my email and calendar, Chrome browser and a full office suite – making an otherwise pretty hopeless old laptop into a useable tool!

Issues: This morning I ran out of battery. A sign came up to say the battery is low – save your work – but that that point the mouse and keyboard stopped working – hence saving work was impossible. A moment later, the laptop shut down. I charged it and it came straight back up with the same message – I had no option but to shut it down (sluggish mouse response as an aside). After rebooting all was well.   Also Skype does not appear to survive power cycling and has to be loaded again.

Facebooktwittergoogle_pluspinterestlinkedin
Viewing all 1391 articles
Browse latest View live